
Great Retailers. Great Defensive Plays
Summary
- The business cycle drives asset prices.
- In a strong economy, buy cyclicals.
- These retailers are very sensitive to business cycle developments.
The business cycle is the outcome of business decisions. Politicians try to bias these decisions, but managers rarely change their focus. Business managers' concern is sales - sales do not happen unless goods are on the shelves.
The management of inventory levels to match changes in demand is what drives the business cycle. All my articles deal with this critical decision process and how it impacts many asset classes from gold, to metals, to bonds, to energy and energy stocks.
Source: Author
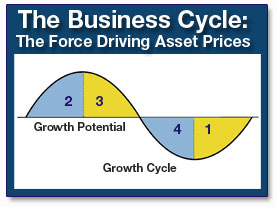
The essence of the inventory cycle is to adjust inventory levels through the production process. At the end of Phase 1 (see above chart), managers recognize inventories were reduced to excessively low levels compared to the underlying demand. They decide, therefore, inventories need to be replenished. This decision results in a series of other decisions such as buying raw materials needed to produce the goods, hiring people and paying them to manufacture the goods, and borrowing money to improve capacity and paying short-term cash needs.
Because of these decisions, commodities, employment, and interest rates stop declining. As income and demand increase, production also needs to expand to build-up inventories. Growth becomes self-sustaining.
In Phase 2 - this is where we are now - manufacturing is very strong. Commodities rise, interest rates rise, and income also increases. Eventually inflation rises toward the end of Phase 2 as productive capacity is stretched to meet demand.
Demand slows down as consumer spending power declines when adjusted for inflation. Business decides to reduce inventories. The slowdown is taking hold in Phases 3 and 4 and the process is exactly the opposite of what was happening in Phases 1 and 2. The outcome is reduction of purchases of raw materials, reduction of employment and wages, reduction of borrowing. These decisions place downward pressure on commodities, inflation, and interest rates.
The strong stock sectors shining in Phases 1 and 2 start to underperform in Phases 3 and 4 (see my article "An Indicator That Assesses Which S&P 500 Sectors Are Likely To Outperform" and "Crude Oil And Energy Stocks: It's Not The Cold Weather, It's The Business Cycle" for a detailed discussion). A new set of sectors and stocks will outperform the market in Phases 3 and 4.
These retailers offer investors a way to implement a defensive investment strategy during the slowdown phases of the business cycle (Phases 3 and 4). They have the same pattern relative to the business cycle as Costco's (NASDAQ:COST) stock price. The pattern discussed in "Costco: A Great Defensive Play, The Issue Is Timing", as of this writing, continued as expected by the model.
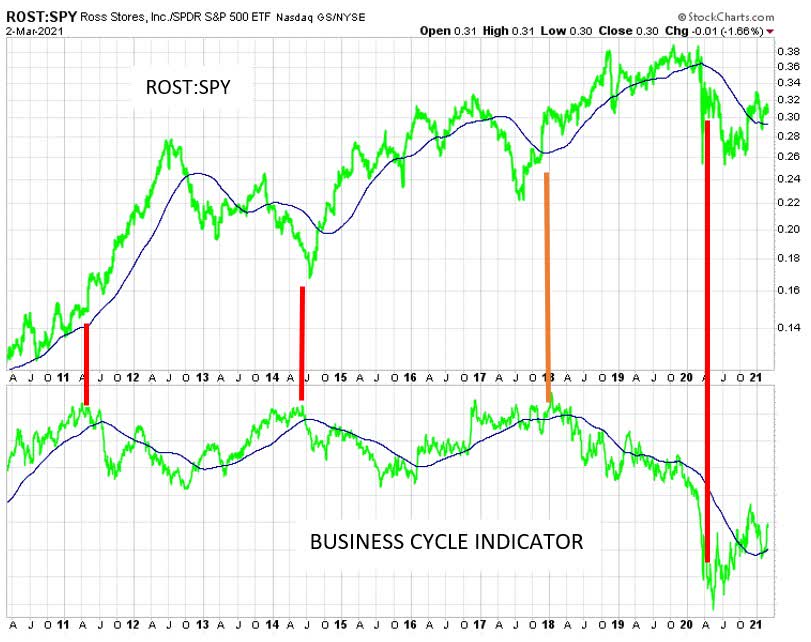
The first stock is Ross Stores (ROST). The above panel of the chart shows the ratio of ROST to the S&P 500 (SPY).
A rising ratio means ROST's stock price is acting better than SPY. Investors outperform SPY by investing in ROST when the ratio rises.
A decline in the ratio means ROST is underperforming SPY. During these times investors should avoid investing in ROST if they want to outperform SPY.
The graph in the lower panel shows my business cycle indicator. This indicator is updated in each issue of my The Peter Dag Portfolio Strategy and Management. A rise in the indicator means the economy is strengthening. The economy is slowing down when this gauge declines.
The experience of the last 10 years shows ROST has been a countercyclical stock. The implication is ROST outperforms SPY when the business cycle indicator declines. It underperforms SPY when the economy strengthens, and the business cycle indicator rises.
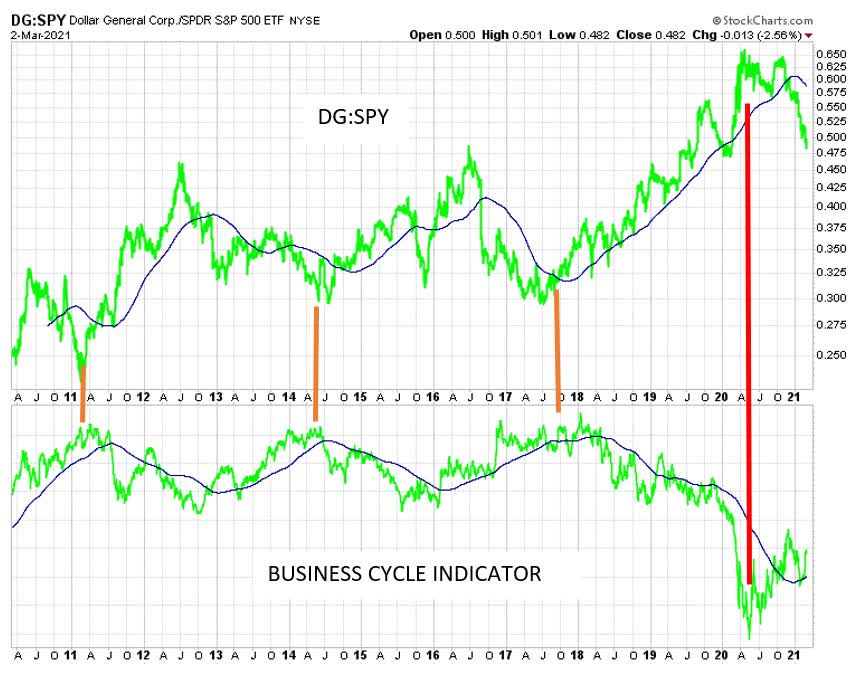
The stock of Dollar General (DG) has a similar pattern to that of ROST. The graph on the upper panel shows the ratio of DG compared to SPY.
A rising ratio implies DG is outperforming SPY. A decline of the ratio means DG is underperforming SPY.
The lower panel shows again my business cycle indicator. Like for ROST, the investment implication of this chart is DG improves the overall performance of the portfolio when the economy slows down and the business cycle indicator declines.
However, when the economy strengthens, and my business cycle indicator rises, DG is likely to penalize the returns of the portfolio due to its underperformance in periods of stronger economic growth.
I am not showing the charts of AutoZone (AZO) and Ulta Beauty (ULTA) because they have similar relationships with the business cycle as COST, ROST, and DG. They outperform SPY when the economy slows down as reflected by a declining business cycle indicator. On the other hand, they underperform SPY when the economy strengthens, and the business cycle indicator rises.
Important Takeaways
DG, ROST, AZO, and ULTA have outperformed the market when the economy slows down and my business cycle indicator declines. (The business cycle indicator is updated in each issue of my The Peter Dag Portfolio).
These stocks penalize the performance of an investment portfolio when the economy strengthens, and my business cycle indicator rises. The reason is they underperform SPY during such times.
During periods of economic strength and rising business cycle indicator, more attractive investments have been discussed in my 3 articles "An Indicator That Assesses Which S&P 500 Sectors Are Likely To Outperform"," Crude Oil And Energy Stocks: It's Not The Cold Weather, It's The Business Cycle", and "Gold Is A Precious Metal, Other Times Not So Much - The Business Cycle Helps You Decide".
Subscribe to The Peter Dag Portfolio Newsletter by clicking here.


Looking for $COST move tomorrow.