
Crypto Chartbook – Portfolio Reload, Step Up To The Plate
Portfolio reload, step up to the plate
When the universe aligns, or better said, when many edges speak in favor for a trading entry, it´s time to take action. Unfortunately, this is easier said than done. As contrarians, these times are often, or should we say best, when others are in disagreement. It is not uncommon that one might have tried once or twice before to get a stab at the market, so it takes courage to increase size and be aggressive at a time when emotions guide otherwise. This was no different on the last significant turning point in the crypto space. We had given entries a chance prior to finally catching it right, as well. Luckily our quad strategy prevents us from experiencing large losses, but it is still difficult for the amateur and professional alike to do the only right thing here: Portfolio reload, step up to the plate.
Nevertheless, discipline was warranted on the 25th to aggressively participate in the market. Stars had aligned, or rather, the charts had...
Weekly chart, BTC/USDT, November 28th 2019, “time to act”:
(Click on image to enlarge)
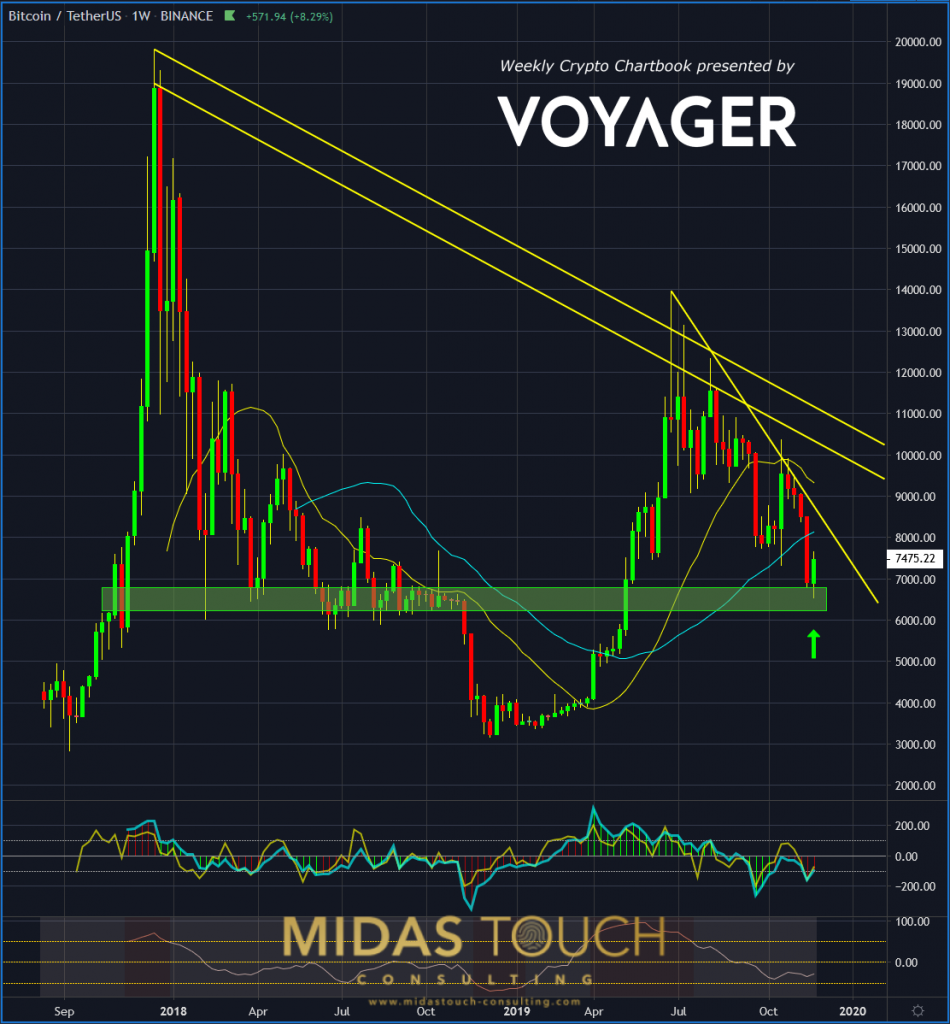
Bitcoin in TetherUS, weekly chart as of October 28th 2019
On the weekly chart, edges show clearly an oversold market penetrating a low-risk entry zone. As such, we not only took a position in bitcoin itself but also in EOS-X, VET-X, XMR-X, NEBL-X, VIB-X, IOT-X, XZC-X and NAS-X. We posted all entries in real-time in our telegram channel.
Portfolio reload-step up to the plate, BTC/USDT, daily chart, November 28th 2019, “courage pays”:
(Click on image to enlarge)
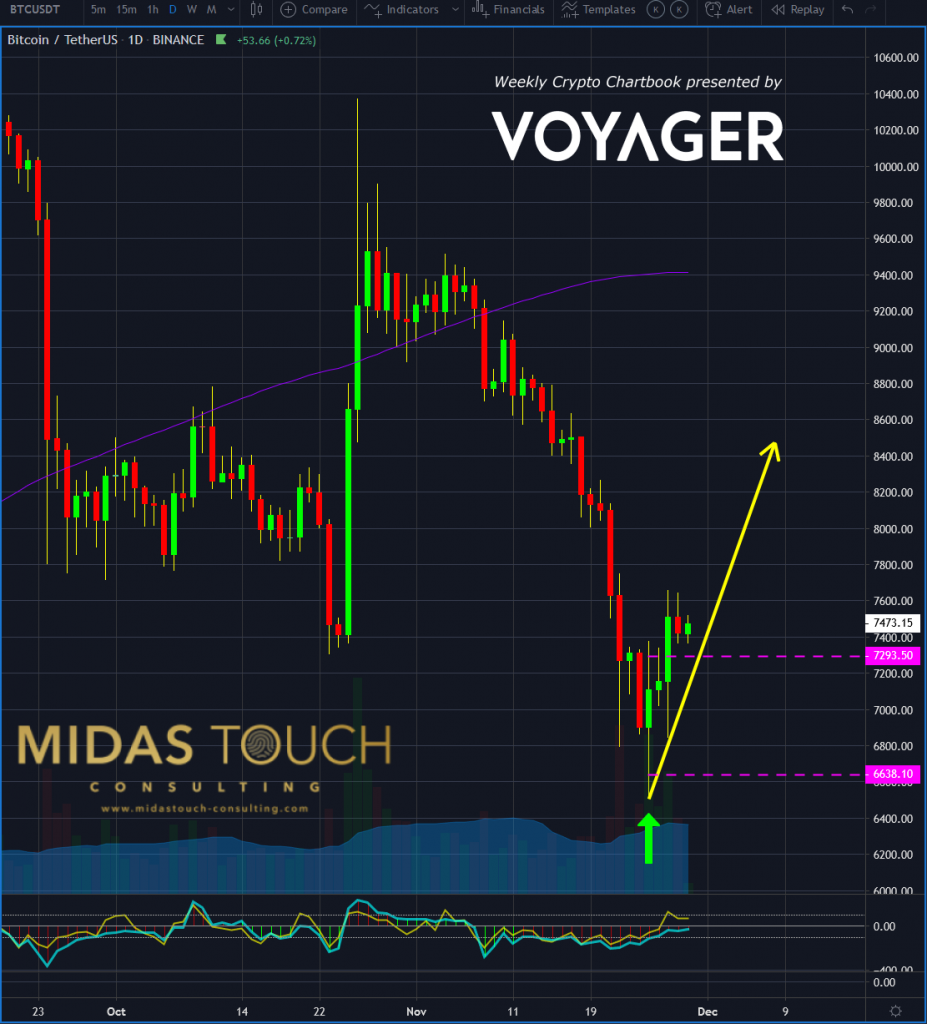
Bitcoin in TetherUS, dailly chart as of October 28th 2019
With a timely entry near the lows at US$6,638.10, we were able to exit half of our position (see our quad strategy) at substantial profits at US$7,293.50. Beta positions like NEBL and VIB of our portfolio reloads had runner profits locked in of 55.5% and 44.3%.
11/28/2019, BTC/USDT, 240-minute chart, “reentry zone”:
(Click on image to enlarge)
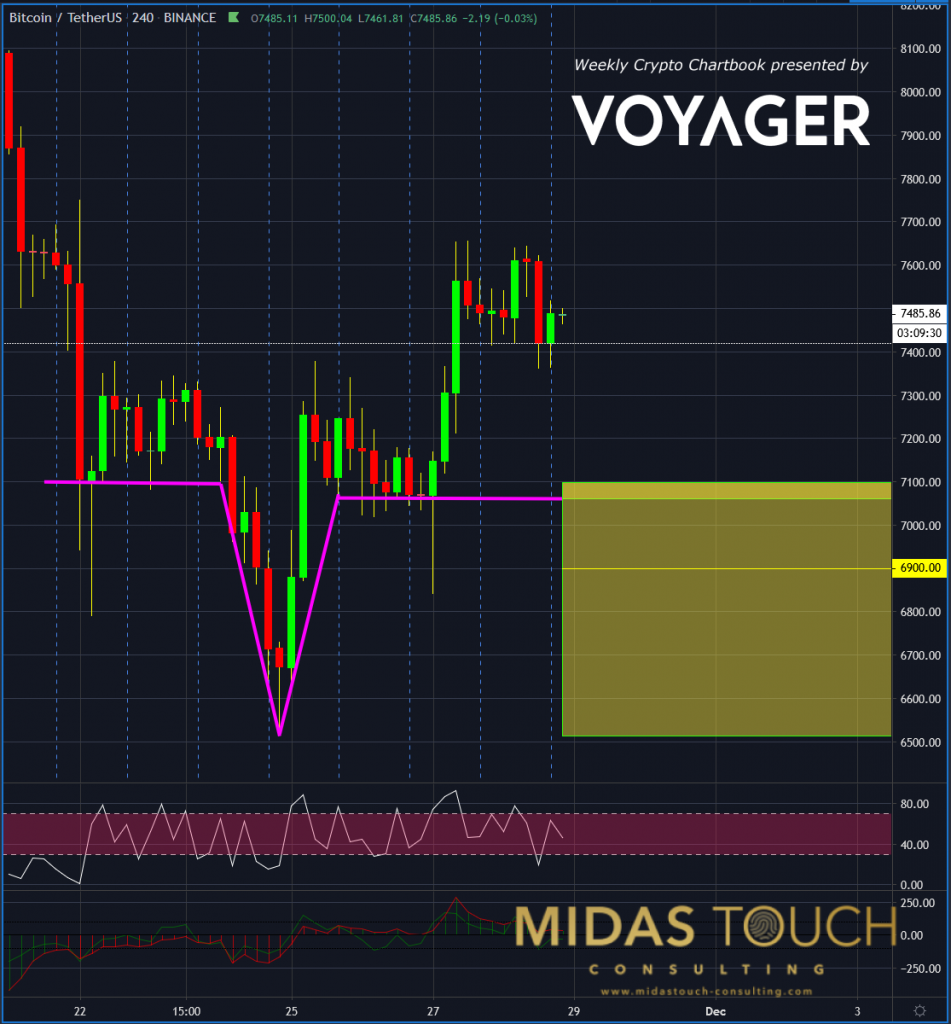
Bitcoin in TetherUS, 240 min chart as of October 28th 2019
This four-hour chart shows clearly that the US$7,100 zone and below would allow for reentries. Should prices revisit this support zone it would again allow for the market participant to risk capital at a low-risk entry zone.
BTC/USDT, 60-minute chart, November 28th 2019, “inverse head and shoulders”:
(Click on image to enlarge)
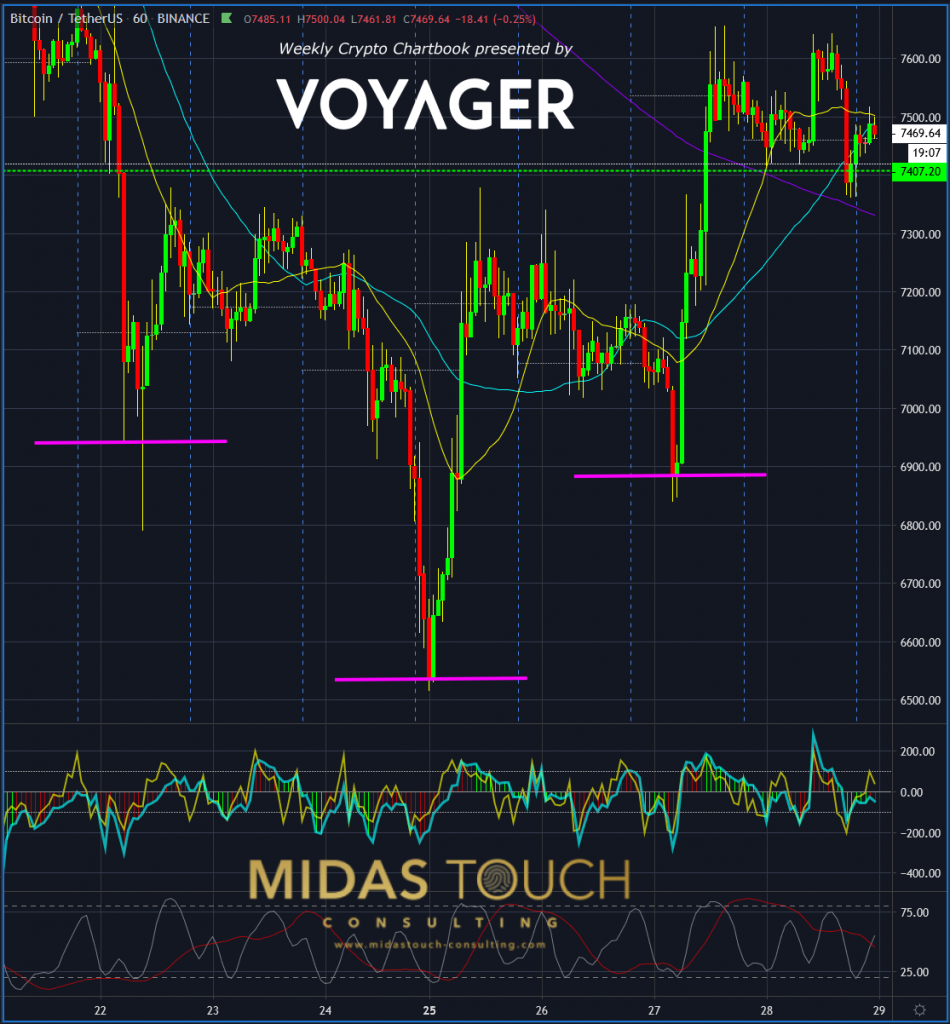
Bitcoin in TetherUS, 60 min chart as of October 28th 2019
On the lower 60-minute time frame, one can easily identify how the reversal came about with an inverse head and shoulder formation. The US$6,900 supply and demand zone is clearly visible in case we retrace with volatility.
Reentries aren’t a guarantee though. At the time of writing, this bitcoin chart-book has already advanced from its lows US$6,515 to as high as US$7,850, a 20.5% price increase.
Portfolio reload-step up to the plate
It is especially important to not be timid in volatile markets like the crypto market. This is because widely drawn-out double bottoms aren’t the typical reversal configuration. Stepping up to the plate is necessary when technical analysis edges are stacked. The trader who is used to slower markets often waits in vain for a second chance opportunity. Meanwhile, prices will quickly move away from the market player for a low-risk entry participation.
Disclosure: None.


