
Buying Stocks Trading Above 10x Sales–A Good Idea?
Early last week, Meb Faber included me on a conversation on buying stocks trading at 10x their company’s revenue (sales).
Is this a good idea and how did it do in the past?
Given that most “known” factors have underperformed over the past 10 years, I was interested in seeing if a somewhat “crazy” strategy
(1)
–buying stocks trading above 10x sales–worked over the past 10 years.
Of course–it worked!
However, over the full sample period, this strategy underperformed the universe.
Needless to say, the results are interesting, especially after examining the current stocks that are trading above 10x revenue.
Below I outline the study, give the results, and look at a few names currently in the “above 10x” category.
Overview and Universe Results
To test how well stocks trading above or below 10x revenue (sales) performed, I formed monthly portfolios examining companies trading above and below 10x revenue (sales). The universe, formed monthly, is the 1,500 largest U.S. stocks excluding REITs.(2) When forming the portfolios, the fundamental data is lagged to minimize look-ahead bias.(3)(4) All data is from FactSet.
The full-time period is from 1/1/1990-3/31/2019.
Below shows the results of the Universe (value-weighted) compared to the Russell 1000 Index (R1K). All results are gross of any transaction costs and fees and reflect total returns, which include dividends.
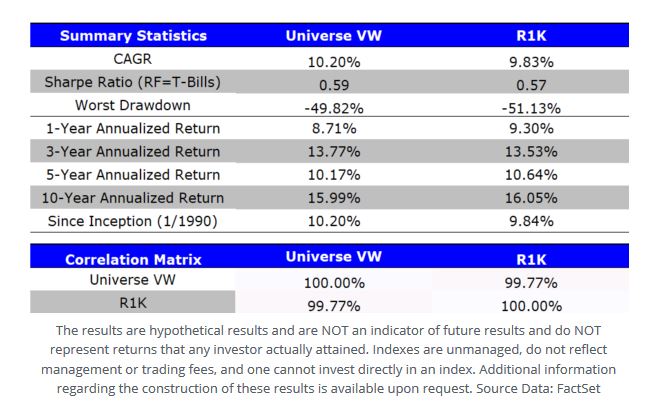
The results above show that the universe is similar to the Russell 1000, with a 99.77% correlation.(5) In addition, the two portfolios have similar CAGRs, Sharpe Ratios, and Drawdowns.
So now that we have confidence in our universe, let’s examine the portfolios trading above and below 10x revenue.
The Results
Below we examine the results to stocks trading above and below 10x sales. Again, the portfolio is formed monthly and held for one month. The time period examined is again from 1/1/1990-3/31/2019. All results are gross of any transaction costs and fees and reflect total returns, which include dividends.
I examine 4 portfolios below:
- Stocks Trading Below 10x Revenue (Below 10x VW)
- Stocks Trading Above 10x Revenue (Above 10x VW)
- Universe
- Russell 1000 (R1K)
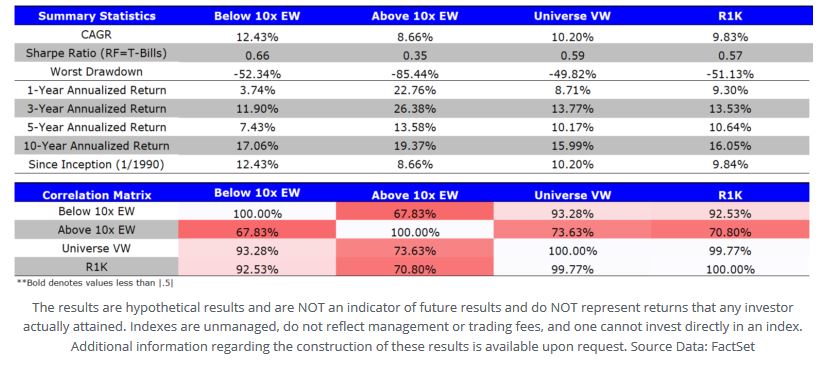
Here are the market-cap weighted (VW) results:
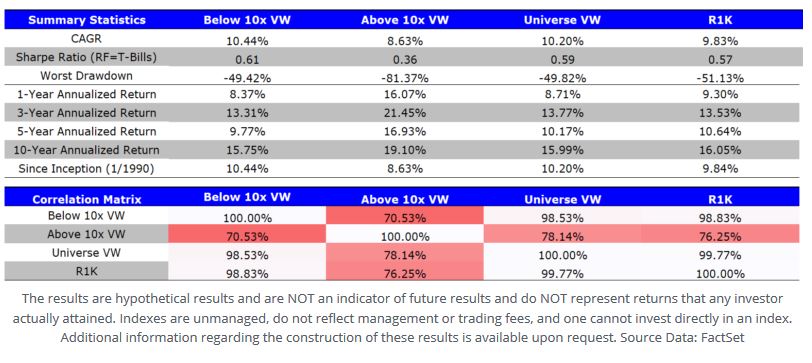
The results above highlight a few items:
- Over the entire time period, buying stocks trading above 10x Revenue was a bad idea!
- Over the past 10 years, buying stocks trading above 10x revenue beat the market! One can see this on the “10-year Annualized Return” row of the table.(6)
- Buying stocks above 10x revenue resulted in an 81.37% maximum drawdown!
To take a deeper dive into point 3 above, I show the annual returns (2019 is until 3/31/19) for the portfolios below:
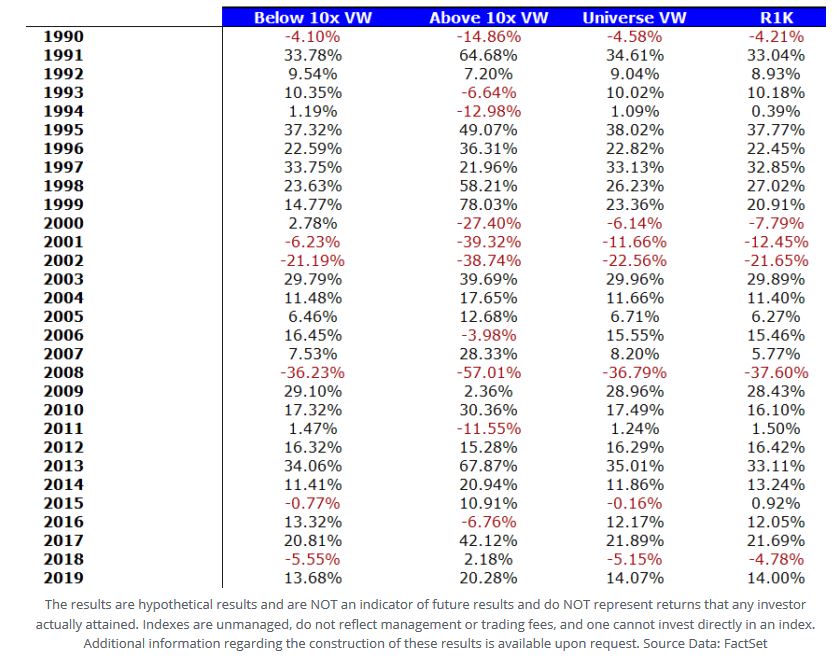
As you can see, the large drawdown occurs in the Internet Bubble Crash (2000-2002) for stocks trading above 10x Revenue.
The results for equal-weighted portfolios are similar and are shown in the footnote below.(7)
Which Stocks Trade at 10x Sales?
First, how many firms are actually trading at 10x sales? Below I show the time-series of the two portfolios:
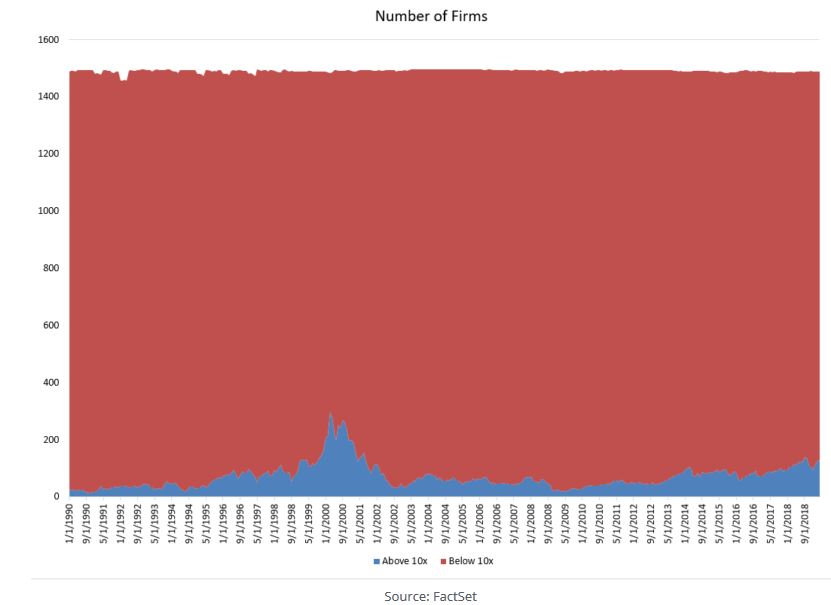
As one can see, most firms are trading below 10x sales. However, there are a decent number of firms above 10x sales. The average number of firms over the entire time period was 70 firms, with the median being 59 firms.(8)
So who is currently trading above 10x revenue? Below I show the 14 largest firms as of 3/29/2019:
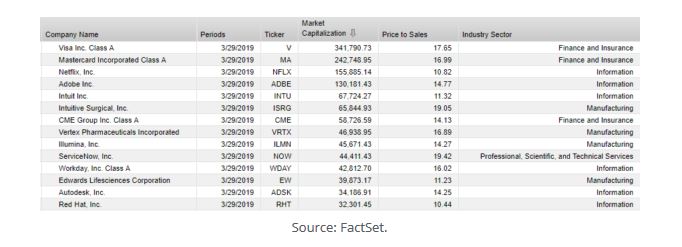
Perhaps not surprisingly, there are many information/technology firms on this list.
Conclusion
So what should we make of these results? First, over the past 10 years, buying stocks trading above a relatively high level of sales (10x) was actually a decent strategy as it would have beat the market (before transaction costs and taxes!). However, over a longer time period, this was a bad bet.
It should be highlighted that this was a monthly-rebalanced strategy, which makes the portfolio trading above 10x sales a “momentum-ish” portfolio. Over the 1/1/1990-12/31/2018, the portfolio trading above 10x sales did have a positive and significant loading on the momentum factor.
So while we say “Never buy expensive stocks, period“, perhaps this study highlights that there may be times (such as the last 10 years!) when this strategy works.
References
1. Especially for Value investors!
2. Additional requirements for the universe: (1) Need 12 months of stock returns, (2) No ADRs, (3) Must have Trading Volume.
3. Specifically, the most up-to-date data is used, first starting with quarterly data (Last Twelve Months), then semi-annual, then annual depending on availability
4. Portfolios are assumed to be rebalanced at the close of the month and held for a month. So the first month’s return, January 1990, was assumed to be formed at the close on 12/31/1989.
5. The small “out-performance” of the universe can probably be attributed to a small “size” tilt, whereby the Universe includes an additional 500 stocks.
6. Before trading costs!
7.
8. Note that there are some observations where the sum of “above” and “below” do not add up to 1,500 firms. Why? Upon review, this was caused by either (1) missing “sales” data or (2) “sales” being so small that it was rounded to 0, leading to an error in the Price/Sales calculation. Since I was examining the top 1,500 firms, I choose not to exclude those with missing data or sales of approximately 0 from the dataset.
Performance figures contained herein are hypothetical, unaudited and prepared by Alpha Architect, LLC; hypothetical results are intended for illustrative purposes only. Past performance is not ...
more

