
A Big Picture Analysis Of Crypto Cycles And Key Levels
Since November 13, 2018, Bitcoin has shed 48 percent, Ripple is off by 43 percent, and Ethereum has plunged by 54 percent. All three coins staged textbook, bearish volatility breakouts (daily chart basis) on November 14th, along with dozens of other coins. Are these big market cap coins closing in on major cycle lows? Is there a rational technical basis for believing the worst of the 2018 crypto bear market is nearing an end? Examine the key crypto cycles and key levels for each coin and reach your own conclusions.
Technicals vs. Fundamentals
Remember that a coin’s technical charts and underlying fundamentals may paint completely different pictures for prospective traders and investors. For example, Bitcoin’s fundamentals appear to be excellent (looking ahead three, five, or even ten years), but that may not be sufficient reason for a short-term swing trader to go long BTCUSD right now. The same could be said for Ripple (XRPUSD) and perhaps even for Ethereum (ETHUSD). In this article, the focus is on technicals, not the fundamentals.
Big Picture Crypto Cycles and Key Levels
Bitcoin Cycles
Every cryptocurrency moves in repetitive price cycles. In fact, every chart time period imaginable has a price cycle. Even three- and five-minute intraday charts have tradable cycles. Identifying future convergences of multiple cycle lows (or highs) can give you a potent crypto trading edge. Here are three multicycle low projection charts for BTCUSD, XRPUSD, and ETHUSD. These are the largest-cap cryptos and serve as a general timing proxy for smaller coins, too.
Have a look at Bitcoin’s weekly cycles chart:
(Click on image to enlarge)
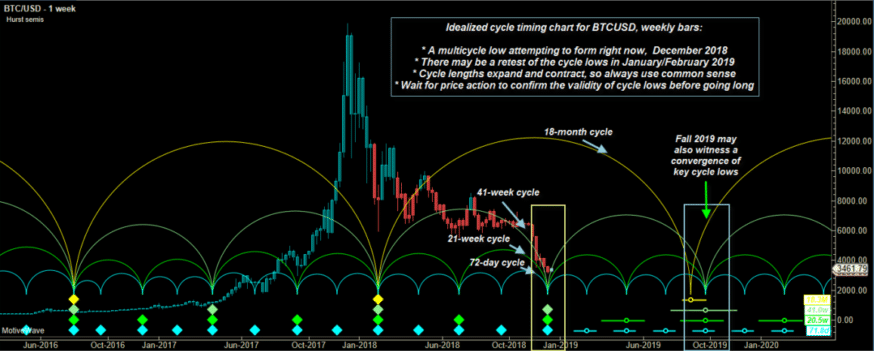
BTCUSD, weekly: Three of Bitcoin’s key price cycles suggest that a major low is near. Expand the chart for a clearer view. Image: MotiveWave.com
Bitcoin offers the most historical data, meaning that its cycle timing data is more reliable than most other coins. The chart reveals that a high-probability multicycle low is attempting to form. The 72-day, 21-week, and 41-week cycles are all in agreement that a major low is near. At the same time, the 18-month cycle suggests that its next major low will occur in the fall of 2019.
Does this mean it’s safe to go long Bitcoin right now? Maybe. Maybe not. Cycle lengths are always subject to random expansions and contractions, even though most markets feature a reliable 18-20 period average cycle length (measured from trough-to-trough). The key word here is average. Some cycles may bottom after only 13 bars. Yet others may expand to 22 or even 25 bars. Long-term, you can expect the average cycle length to always revert to the mean of 18-20 bars. Crypto cycle analysis is effective on price-, volume-, and tick-based charts.
Key Support and Resistance for Bitcoin
A good rule of thumb is to look for bottoming agreement among three or four key cycles. If cycle low agreement exists and the price is trading just above a major support level, the odds of a tradable bullish reversal increase. In Bitcoin’s case, the price has begun to bottom near a key support level (based on the Sept. 2017 swing low of 2,979.88). As of this writing (December 17th), Bitcoin is rallying, perhaps proving the above analysis correct.
However, there is a good chance that the coin will attempt a retest of the recent weekly low at 3,169.53 before attempting to surge higher. So, be nimble with profit-taking if you’re a short-term trader. Notable supply zones (profit-taking areas) exist near 4,200.00 to 4,300.00 and then up near 5,800.00 to 5,900.00.
Ripple Cycles
Ripple’s price action is a bit more ragged than Bitcoin’s, but its cycle forecast still looks very interesting. Ripple is also rallying strong (Dec. 17th), following Bitcoin’s lead. The three-day chart produced the most logical set of cycle low forecasts, and it suggests that late December 2018 to late January 2019 is the time window for the low to appear. Perhaps the ultimate low was already made (last week at 0.2815). The key cycle lengths for Ripple are the 35-day, 70-day, and 20-week (basis the 3-day chart).
(Click on image to enlarge)
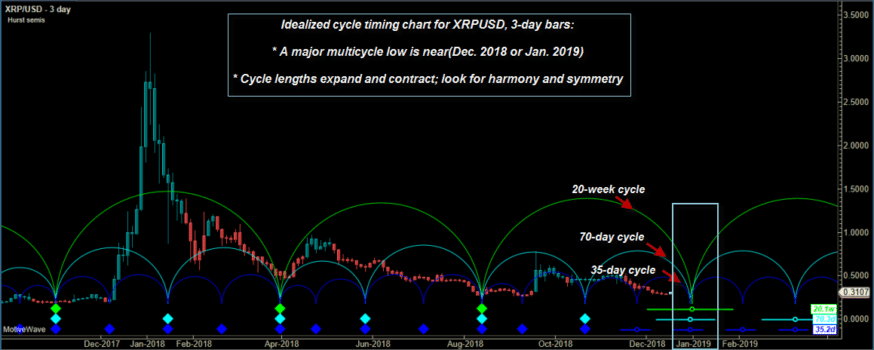
XRPUSD, 3-day chart: Ripple’s cycles forecast implies a major low coming in January 2019. Image: MotiveWave.com
Key Support and Resistance for Ripple
However, Ripple may rally a bit and then pull back to retest that low before moving back up into the 0.3000s. The swing low at 0.2815 was a higher low than those seen in August and September 2018, and that is a major bullish signal for Ripple. A series of higher swing highs and higher swing lows is proof of a bull market, so at least the higher low part of the formula is in effect.
For Ripple to really draw in fresh money, look for a daily close above 0.4042 and then 0.5669. A potential close above 0.5669 would confirm a bull market (swing highs and swing lows basis) in this coin. Price will need to chew through significant supply (traders looking to sell short) at the 0.4700 to 0.5000 levels, so that might be a great profit-taking zone if you go long Ripple soon.
Ethereum Cycles
Ethereum’s long-term price action is decidedly bearish, having retraced 95 percent of its stunning 2017 rally. Its small-range price bars (basis, the 2-day chart), were bleeding ever lower with nary a rebound. Until today, December 17. Ethereum is rallying right along with Bitcoin, Ripple and the rest of the crypto market.
(Click on image to enlarge)
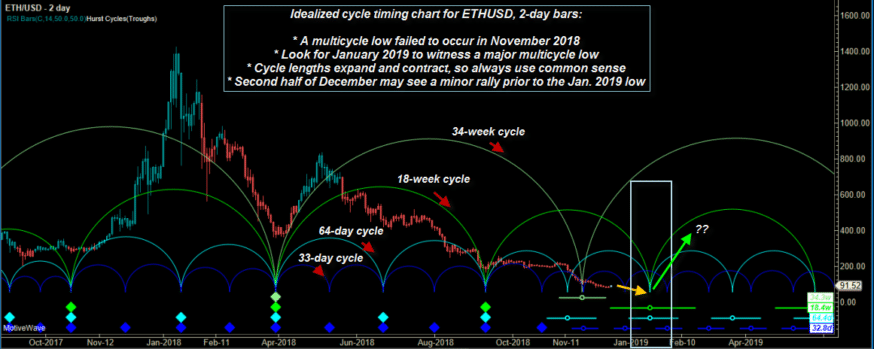
ETHUSD, two-day chart: Ethereum’s slow bleed may finally end as three of its key cycles bottom in early 2019. Image: MotiveWave.com
ETHUSD’s price cycle forecast suggests that its ultimate multicycle low is due in January 2019. That’s when its 33- and 64-day cycles, along with its 18-week cycle are all expected to bottom simultaneously. Note that its 34-week cycle projection (semi-circle) is already in rising mode, so if you do see ETHUSD make a strong bullish reversal in January 2019, there could be significant upside available.
Key Support and Resistance for Ethereum
Of the three coins analyzed here, Ethereum is in the worst technical condition. The next meaningful support level is far below the current price of 94.70. It’s down at 40.99, which is the April 2017 swing low. Yes, last week’s low at 82.05 may offer support on a possible pullback and retest, but if that level quickly fails, look for ETHUSD to attract plenty of short-sellers. On the topside, there’s a lot of supply (potential selling pressure) around the 110.00 to 120.00 area. That would be an excellent place to book some swing trading gains if you’re already long Ethereum.
Additional Observations
There are two other important items that you need to be aware of:
- The Federal Reserve continues to drain liquidity from the US financial system, and at an increasing rate.
- All major US stock indexes feature bearish monthly cycle forecasts. 2019 may be an ugly year for US stock returns.
Granted, a lot of crypto trading occurs outside the US, but the Fed’s continuous emptying of the monetary punch bowl nevertheless leaves less money floating around for speculative purposes. Since most crypto activity is speculation-related rather than transaction-related (at least now), it may take time until the crypto markets experience anything like 2015-2017s stunning rally again.
Therefore, you may wish to be more conservative with your crypto profit targets throughout 2019. A financial system with less liquidity means market upside may be limited and sell-offs could be more brutal. Panicked stock traders may need to raise cash, liquidating their otherwise sound long-term crypto holdings, thus keeping the lid on crypto rallies.
Wise interpretation of crypto cycles and key support and resistance levels can help give you an exploitable trading and investing edge in 2019 and beyond.


