
3 Long Ideas That Remain Attractive Post 2Q21 Earnings
After 2Q21 earnings, we still love these three Long Ideas that have excellent opportunities for profit growth and attractive risk/reward. This week’s Long Ideas are HCA Healthcare Company (HCA: $249/share), Southwest Airlines Company (LUV: $51/share), and Verizon Communications (VZ: $56/share).
We leverage more reliable fundamental data, proven in The Journal of Financial Economics[1], with qualitative research to highlight these firms whose stocks present excellent risk/reward.
Figure 1: Long Idea Performance: From Date of Publication Through 7/27/2021

Sources: New Constructs, LLC
*Measured from the date of publication of each respective report. Dates can be seen in each company section below. Performance represents price performance and is not adjusted for dividends.
Despite Large Gains, HCA Healthcare Still Has 56%+ Upside
We made HCA Healthcare a Long Idea in June 2020. Since then, the stock has outperformed the S&P 500 by 111% and still has more upside.
What’s Working: HCA Healthcare’s 2Q21 revenue of $14.4 billion is up 30% year-over-year (YoY) and 14% higher than 2Q19. Equivalent admissions, which includes both inpatient and outpatient admissions, improved from 903 thousand in 2Q19 to 916 thousand in 2Q21.
HCA Healthcare saw its elective procedures decline in 2020 as people were more reluctant to pursue treatment during the pandemic. However, as COVID admissions as a percent of total admissions fell from 10% in 1Q21 to just 3% in 2Q21, HCA Healthcare saw a 12% increase in outpatient surgery cases from 231 million to 259 million over the same time. With outpatient surgery cases surpassing 2Q19 levels of 253 million, it’s clear that demand for elective procedures has recovered.
One of HCA Healthcare’s strengths is its ability to adapt in the ever-changing healthcare industry. Where telehealth once posed a threat to the firm’s operations, it now helps HCA navigate the challenges involved in providing healthcare service in the midst of a pandemic more efficiently. Going forward, the firm’s physical presence and improved telehealth capabilities position it to better meet the wide-ranging needs of its patients.
As the largest (by revenue) for-profit hospital operator in the U.S., HCA Healthcare leverages its scale to drive superior profitability compared to its peers. Over the trailing-twelve-months (TTM), the firm’s return on invested capital (ROIC) of 19% is more than twice the 8% market-cap-weighted average ROIC of its peers, who include Tenet Healthcare Corp (THC), Community Health Systems, Inc. (CYH), Universal Health Services, Inc. (UHS), Select Medical Holdings Corp (SEM), and Encompass Health Corp (EHC).
What’s Not Working: While most types of procedures, HCA Healthcare offers exceeded pre-pandemic levels in 2Q21, inpatient surgery cases are still 3% below 2Q19 and emergency room visits are 6% below 2Q19.
Though COVID-19 cases are well below the U.S. peak in November 2020, the Delta variant has caused cases to quickly grow over the recent weeks. If cases continue to rise, HCA Healthcare could see the recent uptrend in elective procedures abruptly stop.
The tight labor market in the U.S. could increase HCA Healthcare’s labor costs and put pressure on its margins. Additionally, if the firm is unable to retain staff and fill vacancies with well-qualified individuals, its service quality could suffer. However, the firm’s efforts related to recruitment, retention, and compensation should enable it to navigate the difficult market.
Despite Recent Gains, HCA Is Still Priced for Permanent Profit Decline: HCA Healthcare’s price-to-economic book value (PEBV) ratio is 0.8. This ratio implies that the market expects HCA Healthcare’s profits will permanently decline by 20%.
Below, we use our reverse discounted cash flow (DCF) model to analyze the expectations for future growth in cash flows baked into a couple of stock price scenarios for HCA Healthcare.
In the first scenario, we assume HCA Healthcare’s:
- net operating profit after tax (NOPAT) margin falls to 11% (five-year average vs. 12% TTM) from 2021 through 2030, and
- revenue grows at a <1% CAGR from 2021 to 2030 (vs. consensus CAGR of 7% for 2021- 2023)
In this scenario, HCA Healthcare’s NOPAT falls by <1% compounded annually over the next decade and the stock is worth $249/share today – equal to the current price. See the math behind this reverse DCF scenario. For reference, HCA Healthcare grew NOPAT by 6% compounded annually from 2010 to 2020.
Shares Could Reach $387 or Higher: If we assume HCA Healthcare’s:
- NOPAT margin falls to 11%, (five-year average vs 12% TTM) from 2021 through 2030, and
- revenue grows at a 7% CAGR from 2021 - 2023 (same as consensus), and
- revenue grows at a 3% CAGR from 2024 - 2030 (below 10-year average CAGR of 5%), then
the stock is worth $387/share today – 56% above the current price. See the math behind this reverse DCF scenario. In this scenario, HCA Healthcare grows NOPAT 4% compounded annually over the next decade.
Should HCA Healthcare grow profits closer to historical levels or continue to improve its margins, the upside in the stock is even greater.
Figure 2: HCA Healthcare’s Historical and Implied NOPAT: DCF Valuation Scenarios
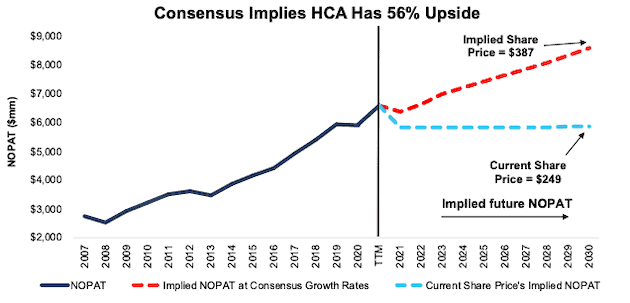
Sources: New Constructs, LLC and company filings
Southwest Airlines: Looks Cheap at Current Price With 61%+ Upside
Southwest Airlines’ stock is up 86% since we added it to our “See Through the Dip” portfolio in May 2020. Though the stock has fallen 20% from its April 2021 highs, we still like its risk/reward.
What’s Working: Southwest Airlines’ 2Q21 revenue of $4 billion is four times greater than 2Q20 and just 32% below pre-pandemic 2Q19 levels. The firm’s revenue in June 2021 was just 21% below revenue in June 2019. The firm is also moving forward with its plan to restore most of its pre-pandemic routes and flights by the end of 2021.
Strong leisure travel demand is leading the firm’s revenue recovery. Southwest Airlines’ leisure passenger traffic in June 2021 was higher than June 2019 and leisure passenger fares in June 2021 were relatively unchanged YoY. Strong leisure passenger traffic also drives more customers to the firm’s Rapid Rewards program, which acquired more members in June 2021 than in any other month in the program’s history.
Equipped with a strong cash balance of $17 billion (compared to just $11 billion in debt), the firm has pursued long-term, strategic growth by adding service to 15 new airports since the start of the pandemic. With more locations in its network, Southwest Airlines is prepared to take market share and grow profits from pre-pandemic levels once travel demand fully recovers.
Another round of the Paycheck Protection Program helped Southwest Airlines maintain its 50-year record of no layoffs, which allows the firm to attract, retain, and maintain trust with its skilled workforce in a highly competitive industry.
Before the pandemic, Southwest Airlines’ ROIC was superior to its competitors. The firm’s 15% ROIC in 2019 was well above its peer group market-cap-weighted average ROIC of 8%. Peers include Delta Airlines (DAL), United Airlines (UAL), and American Airlines (UAL). Its superior profitability enabled it to generate $15.2 billion in free cash flow (FCF) (50% of market cap) from 2015 to 2019. While the firm’s FCF over the TTM is -$4.8 billion, it appears back on track to generate positive free cash flow once again. Southwest Airlines calculates its cash burn in 2Q21 was just $78 million, much improved from around $500 million of cash the firm burned in 2Q20.
As an airline primarily focused on servicing the U.S., Southwest Airlines’ business is prepared to rebound faster than other airlines that have more international exposure. According to the International Air Transport Association, global international passenger demand [measured by revenue passenger kilometers (RPKs)] in May 2021 was down 85% compared to May 2019. However, global domestic demand fared much better in May 2021 and was just 24% below May 2019 levels. In the U.S., the total TSA checkpoint throughput in June 2021 was just 26% below June 2019 levels.
What’s Not Working: Leisure travel has been the primary driver in recovering air demand. According to an American Express’ Back to Blue Skies report, 83% of surveyed decision-makers are optimistic that business travel will recover to pre-pandemic levels by 2023. While an anticipated recovery is positive, airlines may have to suffer another two years of low business travel demand. Low business demand will not only hurt revenue (made up an estimated 35% of Southwest passengers pre-pandemic) but will also put pressure on Southwest Airlines’ margins since business travelers typically pay more than leisure travelers for airfare.
However, Southwest views business demand as a long-term growth driver. In recent years, Southwest has integrated its sales with multiple global corporate travel systems in order to take market share in the business travel space. Prior to this integration, Southwest tickets could only be purchased through Southwest’s own platforms.
In addition to a slow recovery in business travel, rising fuel costs could also slow Southwest Airlines’ recovery. The spot price for U.S. Gulf Coast Kerosene-Type jet fuel rose from $1.33/gal. in December 2020 to $1.86/gal. in June 2021, putting even more pressure on the firm’s margins.
While Southwest Airlines delivered a 2Q21 on-time performance rate of 76%, which is in line with pre-pandemic levels from 2017-2019, it has recently experienced more challenges. Technology and weather issues in June 2021 drove its on-time performance rate to just 62% for the month. While the firm expects to perform much better going forward, more system-wide computer outages could harm its reputation for reliable service.
Priced for Partial Profit Recovery: Below, we use our reverse DCF model to analyze the expectations for future growth in cash flows baked into a couple different stock price scenarios for Southwest Airlines.
In the first scenario, we assume Southwest Airlines’:
- NOPAT margin rises to -10% (vs. -66% TTM) in 2021 and reaches 2% in 2022 and 2023, and
- NOPAT margin reaches 13% (five-year average from 2015-2019) from 2024-2030, and
- revenue grows at a 13% CAGR from 2021-2023 (vs. consensus estimate CAGR of +38%), and
- revenue grows at a 3.5% CAGR from 2024-2030, which is equal to the average annual global GDP growth rate since 1961.
In this scenario, Southwest Airlines’ NOPAT in 2030 is 12% below its 2019 pre-pandemic levels and the stock is worth $51/share today – equal to the current price. See the math behind this reverse DCF scenario. For reference, Southwest Airlines grew NOPAT by 8% compounded annually from 1999 to 2019.
There’s 61%+ Upside Even If Consensus Estimate Are Too Optimistic, and we assume:
- NOPAT margin rises to -10% (vs. -66% TTM) in 2021 and reaches 2% in 2022 and 2023, and
- NOPAT margin reaches 13% (five-year average from 2015-2019) from 2024-2030, and
- revenue grows at a 32% CAGR from 2021-2023 (below consensus estimate CAGR of +38%) 3, and
- revenue grows at a 3.5% CAGR from 2024-2030, which is equal to the average annual global GDP growth rate of 3.5% since 1961, then
the stock is worth $82/share today, or 61% above the current price. See the math behind this reverse DCF scenario.
In this scenario, Southwest Airlines’ NOPAT grows by 3% compounded annually from 2019-2030. For reference, in the five years preceding the pandemic, the firm grew NOPAT by 9% compounded annually. If Southwest Airlines’ revenue grows in line with historical growth rates, the stock has even more upside.
Figure 3: Southwest Airlines’ Historical and Implied NOPAT: DCF Valuation Scenarios
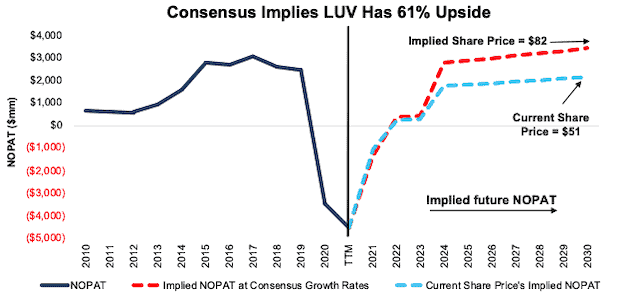
Sources: New Constructs, LLC and company filings
Verizon Has 46%+ Upside
We made Verizon a Long Idea in September 2019 and reiterated it in October 2020. Though the stock has underperformed the S&P 500 since both reports, we believe it still provides attractive risk/reward.
What’s Working: Verizon’s 2Q21 revenue of $33.8 billion is 11% above 2Q20 and 5% above 2Q19. The firm added 528 thousand retail postpaid net additions in 2Q21 compared to just 72 thousand in 2Q20.
Verizon’s excellent quarterly numbers shouldn’t come as a surprise. The pandemic accelerated the long-term structural shifts toward work from home, distance learning, streaming entertainment, and telehealth, all of which rely on high-speed mobile networks. Verizon is well-positioned to profit from this permanent change in consumer behavior.
Verizon plans to divest its media group in 2H21, which prepares the firm to be even more focused on what it does best – providing a high-quality mobile network. RootMetrics awarded Verizon’s network as the best overall network performance and network reliability in 1H21 for the 16th consecutive year. JD Power awarded Verizon for being number one in network quality for the 27th consecutive time in 1H21.
Verizon’s leading network creates a competitive advantage that, with prudent management, will allow the firm to improve its industry-leading ROIC. Over the TTM, the firm’s ROIC of 8% is superior to AT&T’s (T) ROIC of 4%, and T-Mobile’s (TMUS) ROIC of 5%.
The ongoing 5G network rollout gives Verizon an opportunity to further differentiate itself as a high-speed, reliable mobile network provider. In March 2021, Verizon won an auction from the FCC for C-Band spectrum, and the firm anticipates 100 million Americans will be covered by its 5G Ultra Wideband by March 2022.
Verizon’s stock also offers investors something that is very difficult to find in today’s low interest-rate environment – a 4.5% yield. The firm generates plenty of FCF to support its dividend, too. Over the past five years, Verizon has generated $63 billion (27% of market cap) in FCF while paying out $49 billion in dividends.
What’s Not Working: The firm’s commercial-focused segment experienced a 17 basis point increase in postpaid churn in 2Q21 compared to 2Q20, which Verizon attributed to disconnects from COVID-related purchases, particularly within the education market in its public sector business. Given expectations for more in-person learning and return to public offices, management expects disconnects (and therefore churn) to remain elevated in its public sector business in the third quarter of 2021.
The failure of the firm’s media investments shows the difficulty in finding profitable growth opportunities outside of its core competency. However, with the CEO responsible for its misguided AOL and Yahoo acquisitions gone, we expect the firm to manage capital more prudently and increase focus on growing profits in its core business.
While Verizon’s 5G rollout offers the firm an opportunity to improve its service, it comes at a cost. The firm spent $53 billion (25% of market cap) to secure its C-Band spectrum rights. If the firm’s heavy investment in 5G does not generate adequate returns, then the big 5G bet could be a cash burner. However, this scenario seems unlikely given that 60% of the firm’s new accounts in 2Q21 opted for a premium unlimited plan.
Priced for Permanent 50% Profit Decline: Verizon’s PEBV ratio[2] is 0.5. This ratio implies that the market expects Verizon’s profits will permanently decline by 50%.
Below, we use our reverse DCF model to quantify the expectations for future growth in cash flows baked into a couple different stock price scenarios for Verizon.
In the first scenario, we assume:
- Verizon’s NOPAT margin falls to 16% (which is the firm’s 20-year average, compared to 20% TTM) from 2021 through 2030 and
- revenue falls at a 1% CAGR from 2021-2030 (vs. consensus estimate CAGR of +2% from 2021 to 2023)
In this scenario, Verizon’s NOPAT falls by 3% compounded annually over the next decade and the stock is worth $56/share today – equal to the current price. See the math behind this reverse DCF scenario. For reference, Verizon grew NOPAT by 4% compounded annually over the past 10 years and 5% compounded annually over the past five years.
$82/Share If Consensus Is Right, and we assume:
- Verizon’s NOPAT margin falls to 16% (which is the firm’s 20-year average, compared to 20% TTM) from 2021 through 2030 and
- revenue grows at a 2% CAGR from 2021-2023 (equal to consensus estimates) and
- revenue grows at a 1% CAGR from 2024-2030, which is below the average annual global GDP growth rate of 3.5% since 1961, then
the stock is worth $82/share today, or 46% above the current price. See the math behind this reverse DCF scenario. In this scenario, Verizon’s NOPAT falls by 1% compounded annually over the next decade. Should Verizon’s NOPAT grow in line with historical growth rates, the stock has even more upside.
Figure 4: Verizon’s Historical and Implied NOPAT: DCF Valuation Scenarios[3]
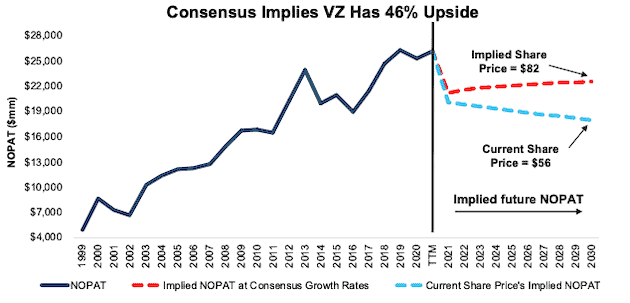
Sources: New Constructs, LLC and company filings
Other Long Ideas That Recently Reported
Figure 5 shows other Long Ideas that have recently reported calendar 2Q21 earnings along with their relative performance.
Figure 5: More Long Ideas That Recently Reported Earnings: Through 7/27/2021
| Company | Ticker | Date Published | Earnings Date | Out (under)performance vs. S&P 500* |
| Alphabet | GOOGL | 2/15/18 | 7/27/21 | 81% |
| D.R. Horton | DHI | 4/27/20 | 7/22/21 | 68% |
| JPMorgan Chase & Company | JPM | 5/21/20 | 7/13/21 | 19% |
| Skechers USA | SKX | 5/16/18 | 7/22/21 | 14% |
| Discover Financial Services | DFS | 10/9/19 | 7/21/21 | 13% |
| Universal Health Services | UHS | 8/19/20 | 7/26/21 | 12% |
| Omnicom Group | OMC | 5/6/20 | 7/20/21 | (19%) |
| Intel Corporation | INTC | 8/6/20 | 7/22/21 | (22%) |
| PepsiCo | PEP | 9/27/17 | 7/13/21 | (33%) |
Sources: New Constructs, LLC
* Measured from the date of publication of each report. Performance represents price performance and is not adjusted for dividends.
[1] Our research utilizes our Core Earnings, a more reliable measure of profits, proven by professors at Harvard Business School & MIT Sloan.
[2] We calculated Verizon’s economic book value using a 3-year average WACC to normalize the impact of significantly lower WACC in 2020 and the TTM period.
[3] We use the override capabilities in our DCF model to replace Verizon’s TTM WACC (2.6%) with its 3-year average WACC (3.8%) in both scenarios.
Disclosure: David Trainer owns LUV, JPM, and DHI. David Trainer, Kyle Guske II, and Matt Shuler receive no compensation to write about any specific stock, sector, style, or theme.
Disclosure: ...
more

