
Intra-Sector Performance Of Technology
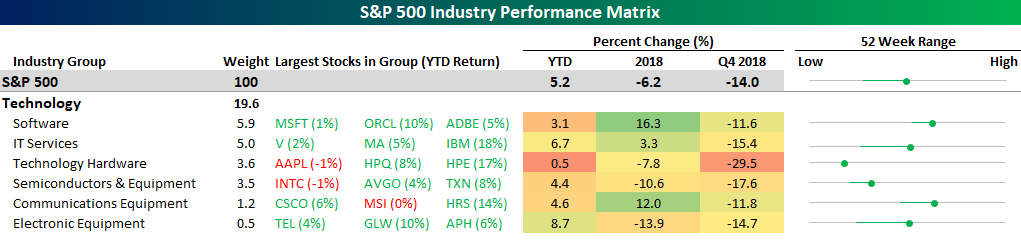
After a horrendous Q4 where every industry within the Technology sector fell more than 10% (and in many cases much more), the sector has gotten off to a positive start in 2019 with a YTD gain of 5.2%. Within the sector, though, the gains haven’t been balanced. The matrix below shows the performance of each of the industries within the Technology sector YTD, in 2018, as well as in the fourth quarter of 2018. For each industry we also show its weight in the S&P 500, the YTD performance of the largest stocks in the industry, and then finally where the industry is currently trading with respect to its 52-week range (the tails show how the sector’s position within its 52-week range has changed since the end of 2018).
Leading the way higher so far in 2019, the Electronic Equipment industry has rallied 8.7%, led by gains in TE Connectivity (TEL), Corning (GLW), and Amphenol (APH). Behind Electronic Equipment, IT Services, which is primarily made up of Visa (V), Mastercard (MA), and IBM, has rallied 6.7%, but behind these two, no other industry is up more than 5% YTD, and Technology Hardware, which is basically Apple (AAPL), is barely holding onto YTD gains. That could change in a big way (in either direction) after the close today when AAPL reports.
Technology has so far put in a decent performance in 2019 which is important given that it still makes up nearly 20% of the S&P 500. What is interesting, though, is that the leadership hasn’t necessarily come from the areas of the sector that would normally first come to mind.
(Click on image to enlarge)
Disclaimer: To begin receiving both our technical and fundamental analysis of the natural gas market on a daily basis, and view our various models breaking down weather by natural gas demand ...
more

