
Inflation Shocks, Inflation Vol Shocks, And 60-40 Returns
Not surprisingly, there has been a lot of debate about the ultimate outcome of the current crisis in terms of causing inflation or disinflation, or even deflation. It is also not surprising that the Keynesians who believe that growth causes inflation have come down heavily on the side of deflation, at least in the initial phase of the crisis. Some nuanced Keynesians wonder about whether there will be a more-lasting supply shock against which the demand-replacement of copious governmental programs will force higher prices. And monetarists almost all see higher inflation after the initial velocity shock fades or at least levels out.
What is somewhat amazing is that there is still so much debate about whether investments in inflation-related markets and securities, such as TIPS and commodities (not just gold), make sense in this environment. A point I find myself making repeatedly is that given where inflation-sensitive markets are priced (inflation swaps price in 1% core inflation for the next 7 years, and commodities markets in many cases are near all-time lows), the potential results are so asymmetrical – heads I win, tails I don’t lose much – that it’s almost malpractice to not include these things in a portfolio. And it’s just crazy that there’s any debate about that. The chart below shows the trailing 10-year annualized real return for various asset classes, as a function of the standard deviation of annuitized real income.[1]
(Click on image to enlarge)
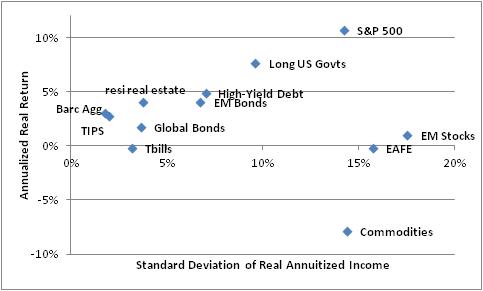
Most of the markets fall along a normal-looking curve in which riskier markets have provided greater returns over time. No guarantee of course – while expectations for future returns ought to be upward-sloping like this, ex-post returns need not be – and we can see that from the extreme deviations of EAFE and EM stocks (but not bonds!) and, especially, commodities. Wow! So if you’re just a reversion-to-the-mean kind of person, you know where you ought to be.
Now, that’s true even if we completely ignore the state of play of inflation itself, and of the distribution of inflation risks. Let’s talk first about those risks. One of the characteristics of the distribution of inflation is that it is asymmetric, with long tails to the upside and fairly truncated tails to the downside. The chart below illustrates this phenomenon with rolling 1-year inflation rates since 1934. Just about two-thirds of outcomes in the US were between 0% and 4% (63% of total observations). Of the remaining 37%, 30% was higher inflation and 7% was deflation…and the tails to the high side were very long.
(Click on image to enlarge)

This phenomenon should manifest in pricing for inflation-linked assets that’s a little higher than implied by a risk-neutral expectation of inflation. That is, if people think that 2% inflation is the most likely outcome, we would expect to see these assets priced for, say, 2.5% because the miss on the high side is potentially a lot worse than a miss on the low side. This makes the current level of pricing of inflation breakevens from TIPS even more remarkable: we are pricing in 1% for the better part of a decade, and so the market is essentially saying there is absolutely no chance of that long upward tail. Or, said another way, if you really think we’ll average 1% inflation for the next decade, you get that tail risk for free.
Finally, there’s the really amazing issue of how traditional asset classes perform with even modest inflation acceleration. Consider the performance of the classic “60-40” mix (60% stocks, 40% bonds) when inflation is stable, compared to when it rises just a little bit. The following table is based on annual data from NYU’s Aswath Damodaran found here.
(Click on image to enlarge)

Note that these are not real returns, which we would expect to be worse when inflation is higher; they are nominal returns. 60-40 is with S&P 500, dividends reinvested and using Baa corporate bonds for the bond component. And they’re not based on the level of inflation. I’ve made the point here many times that equities simply do poorly when inflation is high, and moreover 60-40 correlations tend to be positive (on this latter point see here). But even I was surprised to see the massive performance difference if inflation accelerates even modestly. Regardless of how you see this crisis playing out, these are all important considerations for portfolio construction while there is, and indeed because there is, considerable debate about the path for inflation. Because once there is an agreement, these assets won’t be this cheap anymore.
[1] Credit Rob Arnott for an observation, more than a decade ago, that an inflation-adjusted annuity for a horizon is the true riskless asset against which returns over that horizon should be measured. The x-axis here is the volatility of the return stream compared with such a (hypothetical) annuity. This is important because it illustrates that TIPS, for example, are lots less volatile in real space – the one we care about – than are Treasuries.


