
Inflation Sensitivity To Gaps And Shortfalls
Suppose maximal output evolves as a line between peaks in output, as discussed in this post updating the Summers-Delong approach. The is the “slack” thus defined (red line) a clearer determinant of inflation than the traditional output gap (black line)?
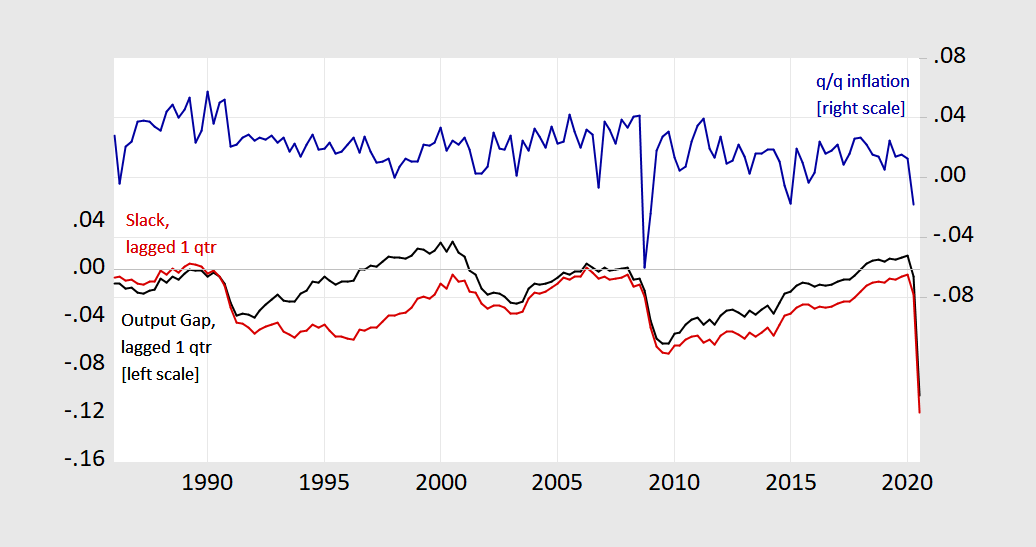
Figure 1: Output gap (black), slack (red), both lagged one quarter, and Personal Consumption Expenditure deflator q/q annualized inflation (blue). Output gap measured using CBO estimate potential GDP, slack or “shortfall” measured using Summers-Delong (1988) method. Source: BEA, CBO (July 2020), and author’s calculations.
The above graph suggests a positive correlation that is loose in either case. Theory in typical textbook treatments suggests that actual inflation is a function of both an activity measure and expected inflation:
![]()
Where y-hat can be either the output gap or slack. Expected inflation could be measured a variety of ways; for simplicity, I just assume:
![]()
Here are scatterplots of
![]()
against y-hat, for the 1986-2020Q2 period (“The Great Moderation”).
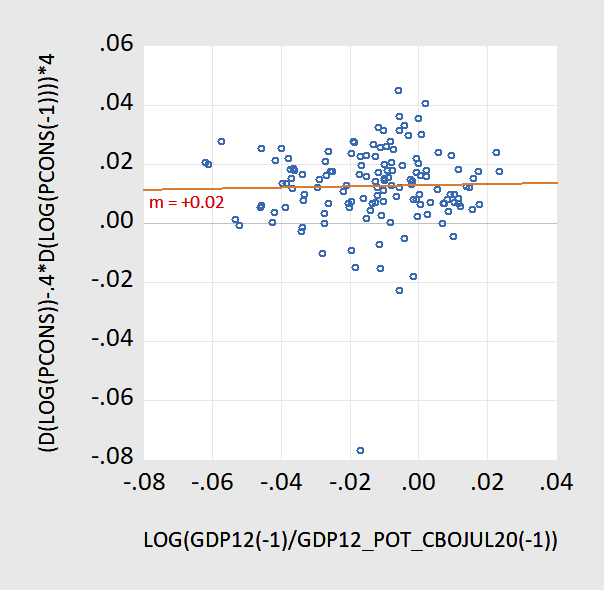
Figure 2: Actual-expected inflation proxy vs. output gap, 1986-2020Q2.
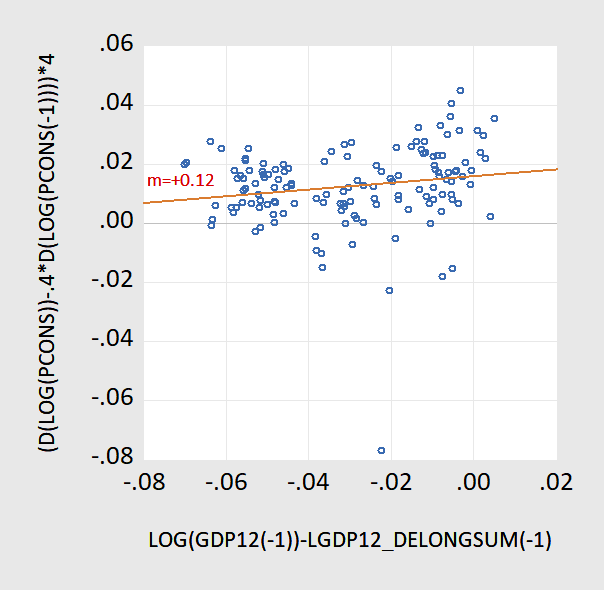
Figure 3: Actual-expected inflation proxy vs. slack/”shortfall”, 1986-2020Q2.
The responsiveness of inflation is both economically and statistically more significant when using the shortfall measure. Of course, an alternative interpretation of these results would be an asymmetry in the Phillips curve with a kink at output gap at zero.
Disclosure: None.


