
Inflation Phases: From Deflation Repair To Inflation Despair
In a new note out of Goldman's Christian Mueller-Glissmann, the strategist looks at the impact of inflation on balanced portfolios, and writes that even as US inflation expectations have fully recovered and investors are moving from fading deflation risk to pricing an inflation overshoot (which in moderation is good since "higher inflation matters critically for balanced portfolios, which tend to perform best when growth accelerates but inflation pressures are limited") so far the rise in inflation expectations "has not been a headwind for 60/40 portfolios as investors mostly faded deflation risk".
But with inflation expectations and real rates both rising sharply higher, the drag from bonds and pressure for higher equity allocations increases, also as bond yields remain close to the zero lower bound. And with higher and rising inflation the risk of rate shocks is higher, with Goldman warning that equities and bonds have often declined together in real terms (eventually).
Looking at the historical record, we find that the S&P 500 has been very positively correlated with US 10-year breakeven inflation and negatively with US10-year TIPS (or Real) yields .
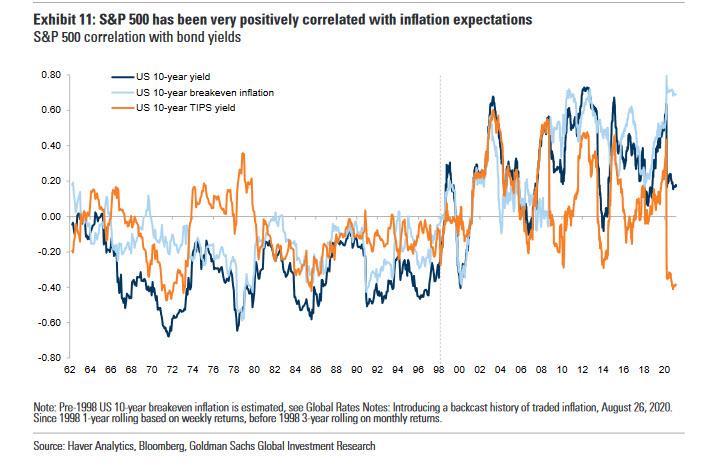
As Goldman observes, over the past two decades with inflation anchored and surprises skewed to the downside, equities have generally digested higher bond yields well. At least this was the case outside of negative rate shocks, when bond yields increased too fast, e.g., the US ‘taper tantrum’ in May 2013. But with rising inflation the potential for surprises and overshoot increases – there are three distinct "inflation phases" investors have to keep an eye on (not to be confused with the three catalysts listed by Morgan Stanley which would hint at an imminent yield blast off). We list them below:
1. Rising inflation expectations due to fading deflation risk.
Last year real yields declined as breakeven inflation recovered from low levels and nominal bond yields were anchored close to the zero lower bound. As a result, breakeven inflation and real rates have moved in opposite directions, which has seldom been the case (chart 12 below). This new real rate regime has been supported by very dovish central bank policies and guidance during the COVID-19 recovery. And as Goldman notes, "breakeven inflation has been closely linked to growth expectations" (actually, what it's even more closely linked to is the price of oil). It was similar post the GFC: real yields declined as investors faded deflation risk and nominal rates were anchored.

Fading deflation risk boosted equities last year while the bond sell-off has been mild. In particular, valuations for structural growth stocks, e.g., US Tech, have increased as their long-term growth expectations were stable but lower bond yields reduced their cost of equity; as a result, equity duration increased, in particular in the US. But this regime exacerbates both positive and negative growth shocks. For example, with inflation expectations falling faster than nominal bond yields at the zero lower bound during the COVID-19 growth shock, real yields increased sharply, further weighing on equities.
2. Early inflation overshoot and risk of rate shocks.
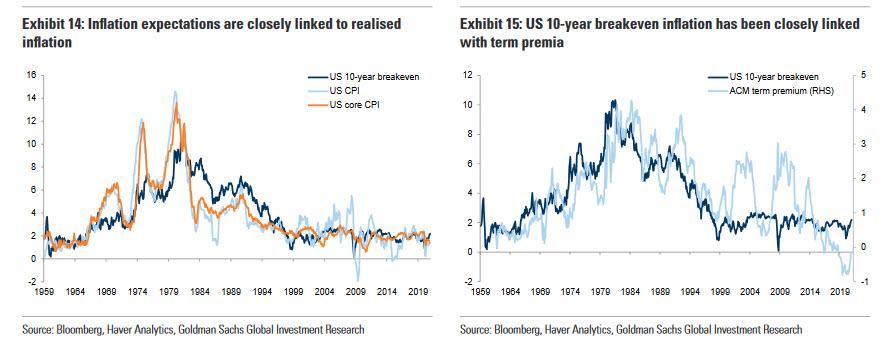
As markets shift from fading deflation risk to pricing an inflation overshoot, the drag from bonds on 60/40 portfolios increases. Nominal rates have been anchored so far as inflation expectations have mainly retraced earlier declines but stayed below central bank targets. However, US 10-year breakeven inflation has been closely linked to realized inflation and a continued inflation pick-up, even if due to base effects, might drive an overshoot. As inflation, both expectations and realized, rises above central bank targets, upward pressure on nominal bond yields increases. Since the late 1990s inflation expectations have been range bound and negatively skewed (Exhibit 14). With higher inflation, breakevens might break out of that range and become more positively skewed. Bond term premia are likely to increase and bonds become a larger drag in balanced portfolios (Exhibit 15). From low levels equities should digest higher yields with better growth and as long as increases are gradual, pointing to larger equity/smaller bond allocations.
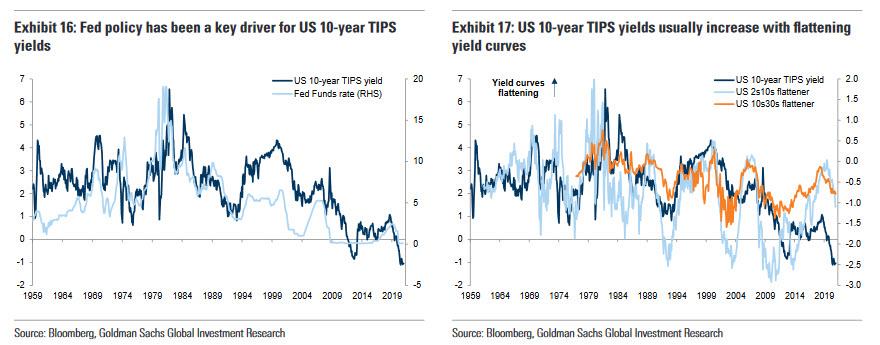
After the "friendly" real rate regime during the COVID-19 recovery, changes in real yields will matter more. Higher real yields might weigh on equities, especially long duration growth stocks, unless they come along with better growth. Historically,real yields were often linked to an actual or perceived shift in central bank or fiscal policy. Rising US 10-year TIPS yields were mostly linked to the Fed fund rate hiking cycles (Exhibit 16). In recent years, with policy rates near the effective lower bound and more QE, real yields also increased with hawkish central bank guidance – examples include the US ‘taper tantrum’ in May 2013. Goldman expects most central banks to lean dovish early in the recovery, as is often the case, especially with the Fed’s new AIT policy. To that point, that bank's rates team thinks real rates will start to increase gradually alongside breakeven inflation, supported by the COVID-19 recovery and larger US fiscal stimulus. Higher real rates due to expectations for more expansive fiscal policy, e.g., like after the election of Trump in 2016, should be digested well by equities if they support growth. Still, the risk of real rate shocks increases in case of hawkish central bank surprises or negative inflation/ growth shocks.
3. Larger inflation surprises drive higher risk premia across assets
Eventually, higher inflation results in "larger surprises", which weighs more on both equities and bonds. Since the 1990s there has been less pressure for central banks to fight inflation but before that, with higher levels, inflation surprises and volatility were much higher (Exhibit 18). While central banks might allow for an initial overshoot they would likely have to tighten policy to bring inflation under control eventually. Whether central banks and governments will allow larger overshoots than in the last three decades is ultimately a political decision. But even then longer-dated bonds might reprice inflation risk. Bond investors suffer losses in real terms in the event of unanticipated inflation and bond term premia tend to increase with inflation surprises– this might be exacerbated by the supply/demand picture for bonds (Exhibit 19).

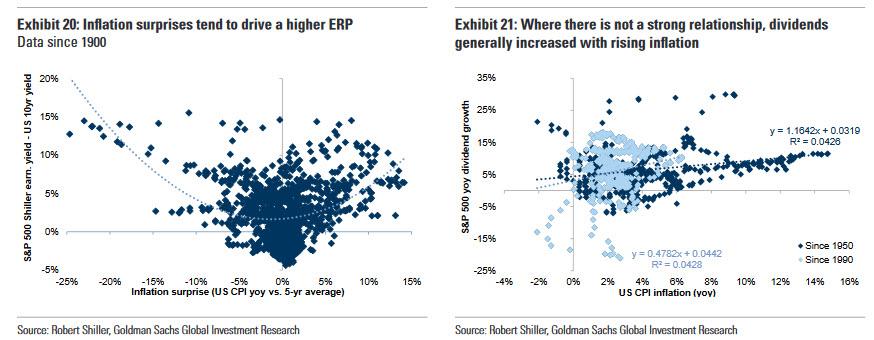
Large inflation surprises, either positive or negative, historically put upward pressure on the Equity Risk Premium (Exhibit 20). However, equities, or at least certain companies, might provide an inflation hedge if they have pricing power, stable input costs and can protect profit margins. The source of inflation will matter – whether it is cost push or demand pull, wage inflation or commodities, etc. Historically, post WW2, dividends increased with inflation although that ratio has dropped below 1 since 1990 (Exhibit 21).
* * *
With these three phases in mind, how should one trade it?
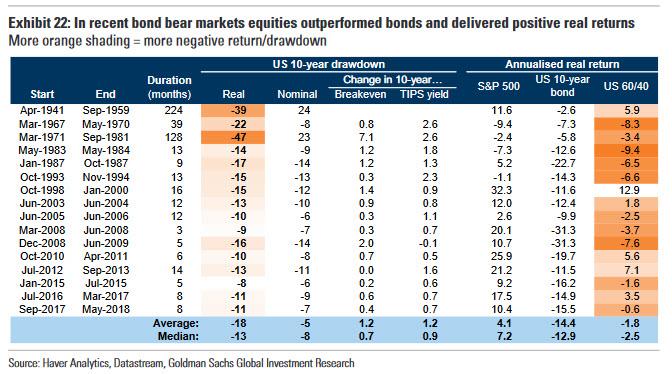
Well, during most bond bear markets equities have outperformed bonds and delivered positive real returns, especially in recent years, as the following Goldman chart shows. With reflation accelerating, the pressure for higher equity and lower bond allocations in balanced portfolios increases (also with less of a buffer from bonds during ‘risk off’). However, this increases vulnerability to deflation or negative inflation surprises and also,eventually, to bond yields and inflation increasing too much.
Before the late 1990s there were several periods when equities and bonds fell together – during those, often real rates increased (more than breakeven inflation) or inflation was very high.
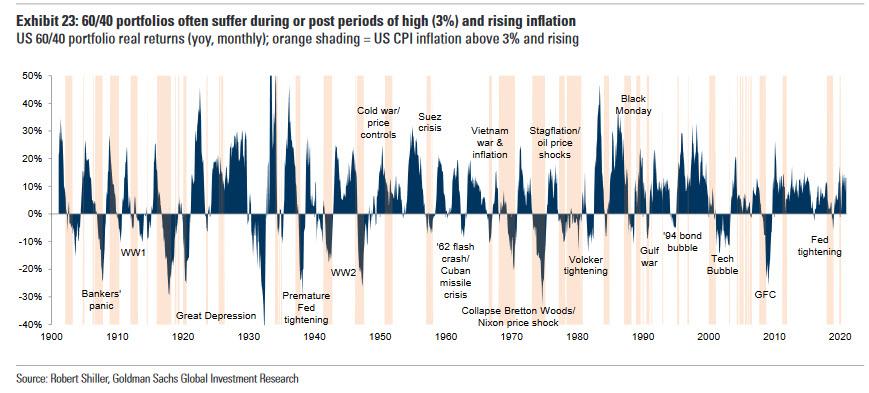
High and rising inflation - like now - often forced central bank tightening and deleveraging, which increased recession risk and macro volatility. However, now that central banks have pledged not rate hikes for years, the real question is what do they do next: do they pretend inflation does not exist (likely), or will they simply shut off the bond market's last remaining signaling pathway, the long-end, and engage Yield Curve Control which the BOJ has been "testing" for the past five years.
Disclaimer: Copyright ©2009-2021 ZeroHedge.com/ABC Media, LTD; All Rights Reserved. Zero Hedge is intended for Mature Audiences. Familiarize yourself with our legal and use policies ...
more

