
Inflation Deceleration – Multiple Measures
In today’s release, headline m/m CPI inflation was down sharply, from 11.4% to 5.8%, annualized. Various measures derived from the data in the release, including the inflation rate of the sticky price CPI — that focuses on infrequently changed prices — declined slightly, suggesting easing pressures. The trimmed CPI — which excises highly volatile components — was also falling indicating it’s not outliers driving July decreases.
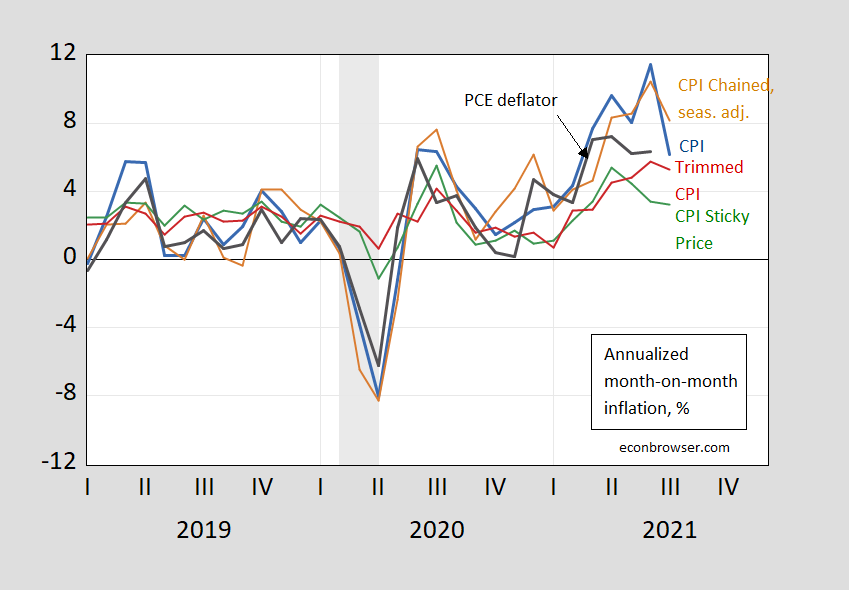
Figure 1: Month-on-month annualized inflation from CPI-all urban (blue), from personal consumption expenditure (PCE) deflator (black), chained CPI(brown), sticky price CPI (green), and 16% trimmed mean CPI (red). Chained CPI inflation seasonally adjusted by author. Source: BLS, Atlanta Fed, Cleveland Fed, via FRED, and author’s calculations.
The general discussion stressing y/y changes is understandable, but frustrating as it really tells almost as much about the past as the present, in the current context.
What about core measures? The core CPI inflation rate was also sharply down, as shown in Figure 2 (no trimmed core shown).

Figure 2: Month-on-month annualized inflation from CPI-all urban (blue), from personal consumption expenditure (PCE) deflator (black), chained CPI(brown), and sticky price CPI (green). Chained CPI inflation seasonally adjusted by author. Source: BLS, Atlanta Fed, Cleveland Fed, via FRED, NBER, and author’s calculations.
The chained CPI and sticky price m/m inflation rates were also down.
In other words, every easily measurable indicator of m/m inflation is down. (I adjusted the not seasonally adjusted chained measures of CPI by calculating the m/m growth rates, and then applying a simple seasonal adjustment that uses deviations from an arithmetic moving average.)
The pandemic has made it more important to examine the role of specific components. CEA notes that the share of m/m inflation (not annualized) accounted for by pandemic affected services and vehicle related items dropped substantially, driving the reduction in overall m/m inflation.. This is shown in this graph:
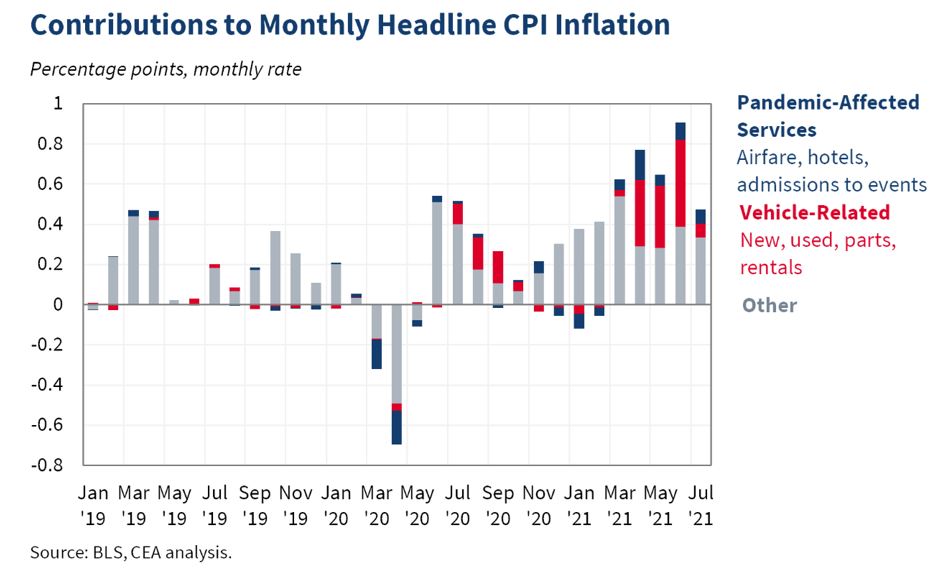
Source: CEA (8/11/2021).
Disclosure: None.


