
Industry Groups Distance From 52-Week Highs: Defensives On The Offensive
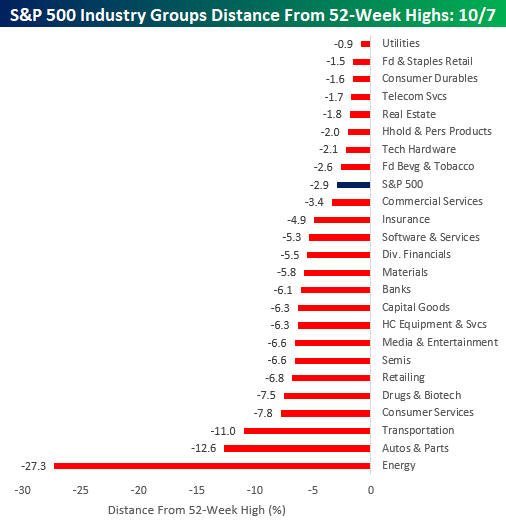
The S&P 500 ended up closing down about 0.50% today but still remains within 3% of its record high in July. The chart below shows where each of the S&P 500’s Industry Groups are trading with respect to their own 52-week highs. While the S&P 500 is less than 3% from its high, the majority of Industry Groups are down at least 5% their own highs. Leading the way to the downside, Energy has been the clear loser with a decline of 27.3%. Behind Energy, just two other groups (Transportation and Autos & Parts), which are both cyclical in nature, are down over 10%.In terms of Industry Groups that have held up the best, they are mostly defensive in nature with Utilities Food & Staples Retail, Consumer Durables, Telecom Services, and Real Estate all trading within 2% of their respective highs.
(Click on image to enlarge)
Start a two-week free trial to Bespoke Institutional to access all of our research and our popular interactive Chart ...
more

