
In Search Of High-Quality Stocks
Investing in high-quality stocks can be a great strategy to maximize returns over the long term, and many of the most profitable stocks in the market over the past several years are in fact high-quality businesses. However, finding high-quality stocks is much easier said than done, and quality can be defined in multiple ways.
But we can also measure business quality in a mathematical way, and profitability is one of the most important indicators of underlying quality.
Success attracts competition in the business world, and this tends to erode profitability. When a company can sustain superior profitability through the years, this generally reflects that it has superior fundamental qualities such as a unique brand, better technology, or a more innovative management team.
There is a clear and direct relationship between business profitability and shareholder returns. If all other variables are the same, the more profitable the business, the higher its ability to create economic value for investors over the long term. In fact, academic research has proven that companies with superior profitability levels tend to produce market-beating returns.
The following quote from Charlie Munger explains with brilliant simplicity why profitability can be a major return driver, and quality can be even more important than valuation when it comes to long-term performance.
Over the long term, it is hard for a stock to earn a much better return than the business, which underlies its earnings. If the business earns 6% on capital over 40 years and you hold it for 40 years, you are not going to make much different than a 6% return - even if you originally buy it at a huge discount. Conversely, if a business earns 18% on capital over 20 or 30 years, even if you pay an expensive looking price, you end up with one hell of a result... So the trick is getting into better businesses"
Quality In The Numbers
The screener eliminates over the counter stocks and companies with a market capitalization level below $250 million from the investable universe in order to put a floor on company size and liquidity.
After that, the screener requires companies to have a Return on Equity (ROE) ratio above 20% over the past 5 years and also on a trailing 12 months basis. The main idea is focusing on companies that have produced elevated profitability not only in recent months but also in the past several years.
Return on Equity (ROE) is calculated as net income divided by the value of total shareholder equity. The metric has both advantages and disadvantages, but it can be a valuable indicator to analyze how effective the company is at generating earnings with each dollar of shareholder capital.
This profitability requirement is quite strict, and it does most of the heavy lifting in terms of stock selection. From a starting universe of almost 6000 stocks, the screen ends up with only 295 companies that meet the specified criteria regarding size and ROE levels consistently above 20%.
Among those 295, we then select the 25 stocks with the strongest ranking based on the PowerFactors algorithm. This is a quantitative algorithm that grades companies in a particular universe according to a combination of factors, including financial quality, valuation, fundamental momentum, and relative strength.
In simple terms, the PowerFactors system is looking to buy good businesses (quality) for a reasonable price (valuation) when the company is doing well (fundamental momentum) and the stock is outperforming (relative strength).
Wrapping up the screener parameters:
- Only companies with a market capitalization value above $250 million are considered.
- Companies need to have a ROE ratio above 20% in the past five years.
- Companies need to have a ROE ratio above 20% on a trailing 12 months basis.
- Among the companies that meet the criteria above, we select the 25 stocks with the highest PowerFactors ranking.
Backtested Performance
The backtest picks the 25 stocks recommended by the screener and it builds an equally weighted portfolio with those names. The portfolio is rebalanced every four weeks, and trading expenses are assumed to be 0.2% per transaction. The backtest makes the information with the data available at each point in time, and the database is free from survivorship bias. The benchmark is the SPDR S&P 500 ETF (SPY).
(Click on image to enlarge)
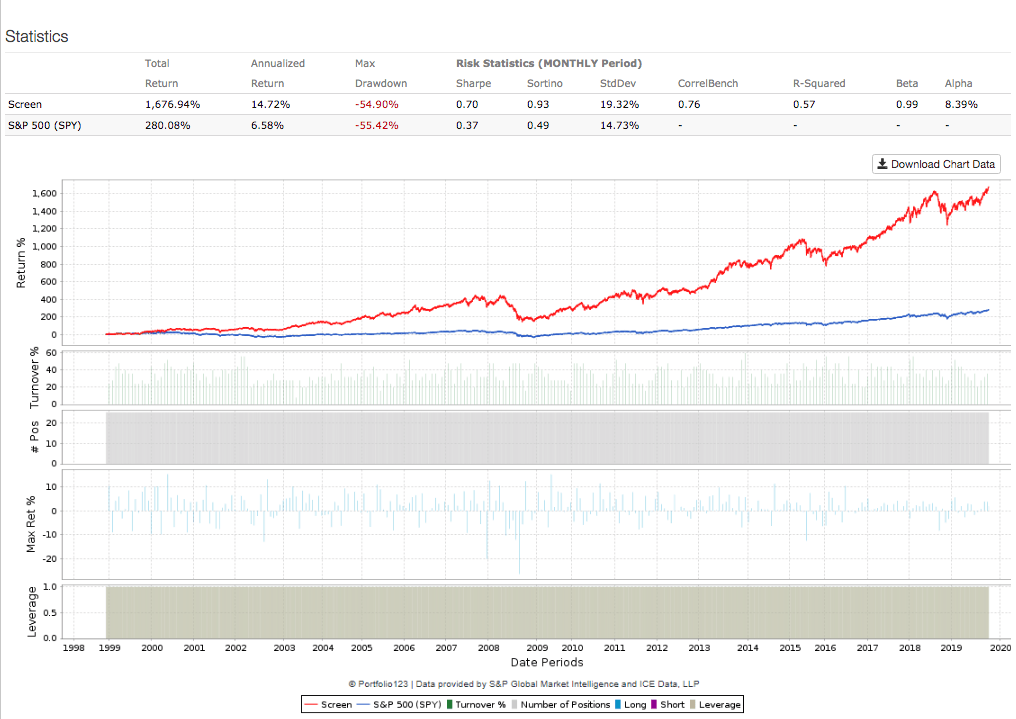
Data from S&P Global via Portfolio123
Since January of 1999, the screener more than doubled the benchmark, with annual returns of 14.72% per year versus an annual return of 6.58% for the market-tracking ETF. In cumulative terms, the system gained 1,677% versus 280% for the benchmark. Alpha during the backtesting period amounts to 8.39%.
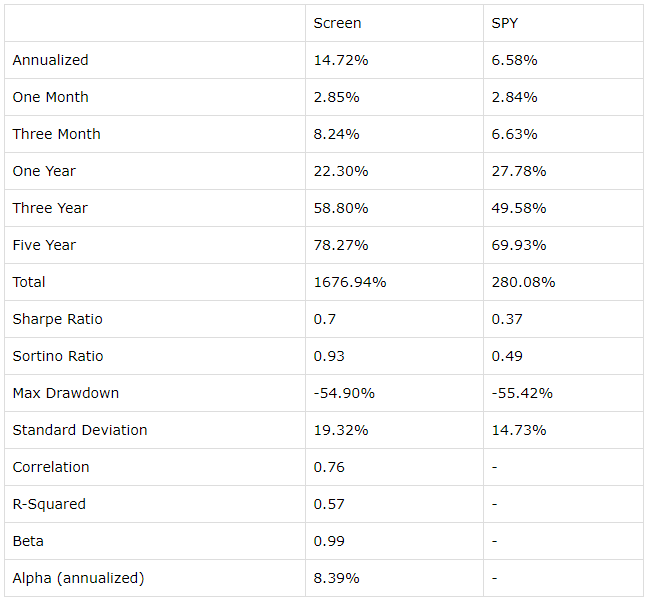
Providing more details, the table below shows returns and risk-adjusted return considerations for the screener versus the benchmark.
(Click on image to enlarge)
Practical Considerations And Portfolio
A quantitative screen such as this one offers an effective tool to make investment decisions based on hard data as opposed to relying on opinions and subjectivities. This can make a huge difference when it comes to keeping emotions under control, a key success driver for investors.
On the other hand, all quantitative screeners are backward-looking by their own nature. Looking at past and present profitability says a lot about a company, but investors need to analyze the main fundamental drivers behind those numbers in order to evaluate sustainability going forward.
ROE levels for different companies can also be affected by financial leverage. Management can rely heavily on debt to increase earnings and boost ROE, which has important risk implications.
The ROE ratio can also be affected by buybacks, when a company repurchases shares, this reduces the accounting value of equity and increases ROE. There is nothing inherently wrong with this financial management strategy, but investors need to consider the different sources of ROE and what they mean in terms of risk and return.
The ROE ratio can also be affected by extraordinary factors and non-recurrent events, such as one time increases in earnings. When this happens, it obviously means that past data does not represent future profitability.
Also, highly profitable companies typically trade at above-average valuation levels. A more profitable business clearly deserves a higher valuation, but it's important to avoid overpriced stocks. Investors may want to take a look at the valuation levels for companies in the system before making any decisions.
The screener intentionally avoids any criteria for sector diversification, because the idea is focusing on the most profitable stocks regardless of sector participation. However, sector concentration also increases volatility.
Those limitations being acknowledged, the table shows the 25 stocks currently selected by the screener. The data also shows market capitalization in millions and ROE levels over both the past twelve months and in the past 5 years.
| Ticker | Name | Mkt. Cap | ROE% TTM | ROE%5 YAvg |
| ALGN | Align Technology Inc. | $21,484 | 33.53 | 22.9 |
| AMGN | Amgen Inc. | $144,245 | 63.83 | 25.12 |
| AAPL | Apple Inc. | $1,242,951 | 55.92 | 45.06 |
| AMAT | Applied Materials Inc. | $55,308 | 35.95 | 31.39 |
| ATKR | Atkore International Group Inc. | $1,910 | 78.34 | 37.55 |
| BIIB | Biogen Inc. | $53,953 | 38.87 | 30.97 |
| BLDR | Builders FirstSource Inc. | $2,922 | 35.29 | 31.53 |
| CDW | CDW Corp. | $20,235 | 67.8 | 45.27 |
| CPRT | Copart Inc. | $20,896 | 38.67 | 32.39 |
| EW | Edwards Lifesciences Corp. | $49,129 | 21.56 | 26.24 |
| FICO | Fair Isaac Corp. | $10,587 | 69.42 | 36.16 |
| GNRC | Generac Holdings Inc. | $6,332 | 31.61 | 30.18 |
| HII | Huntington Ingalls Industries Inc. | $10,320 | 34.67 | 33.47 |
| IBP | Installed Building Products Inc. | $2,156 | 29.62 | 48.3 |
| KEYS | Keysight Technologies Inc. | $19,487 | 22.84 | 21.7 |
| LRCX | Lam Research Corp. | $41,726 | 41.4 | 26.25 |
| LAD | Lithia Motors Inc. | $3,686 | 20.54 | 23.48 |
| NTES | NetEase Inc. | $38,596 | 37.56 | 23.89 |
| PAYC | Paycom Software Inc. | $14,953 | 39.89 | 51.06 |
| QCOM | QUALCOMM Inc. | $100,737 | 150.28 | 31.95 |
| STX | Seagate Technology Plc | $15,442 | 97.46 | 61.14 |
| SWKS | Skyworks Solutions Inc. | $19,709 | 20.77 | 25.52 |
| TPX | Tempur Sealy International Inc. | $4,779 | 59.93 | 138.68 |
| UI | Ubiquiti Inc. | $12,267 | 2147.49 | 66.3 |
| ZTS | Zoetis Inc. | $60,542 | 60.93 | 53.97 |
As always, the main idea is not buying any stock simply because it meets the quality requirements in the screener. As opposed to that, the screener should be used as a source of ideas for further research.
Disclosure: I/we have no positions in any stocks mentioned, and no plans to initiate any positions within the next 72 hours.
Disclaimer: I wrote this article myself, and it expresses my ...
more

