
Improving Economic Prospects
As measured by the February WSJ survey. Even then, mean forecast GDP — presumably conditioned on additional government spending and tax cuts — does not hit potential GDP until the beginning of 2022.

Figure 1: GDP (black), GDP forecast implied by WSJ January survey mean (gold), by WSJ February survey (green), CBO February projection (red), CBO estimate of potential GDP (gray), all in bn.Ch.2012$ SAAR. Source: BEA 2020Q4 advance, CBO, WSJ, and author’s calculations.
Absent additional fiscal measures, CBO estimates output reaches potential only by the beginning of 2025.
The forecasts are not strictly comparable; the CBO projection is conditioned on current law (so no spending/tax cuts past December). In contrast, the WSJ survey forecasts are conditioned on expectations regarding additional legislation. The January survey takes place a week after the Georgia elections but before the inauguration. The February survey incorporates greater expectations of the passage of a substantive fiscal package.
The average disguises an increasing divergence in forecasts. Figure 2 illustrates the dispersion around mean forecast. The highest 2021 q4/q4 growth (Hatzius) and lowest (Roman) are shown below.
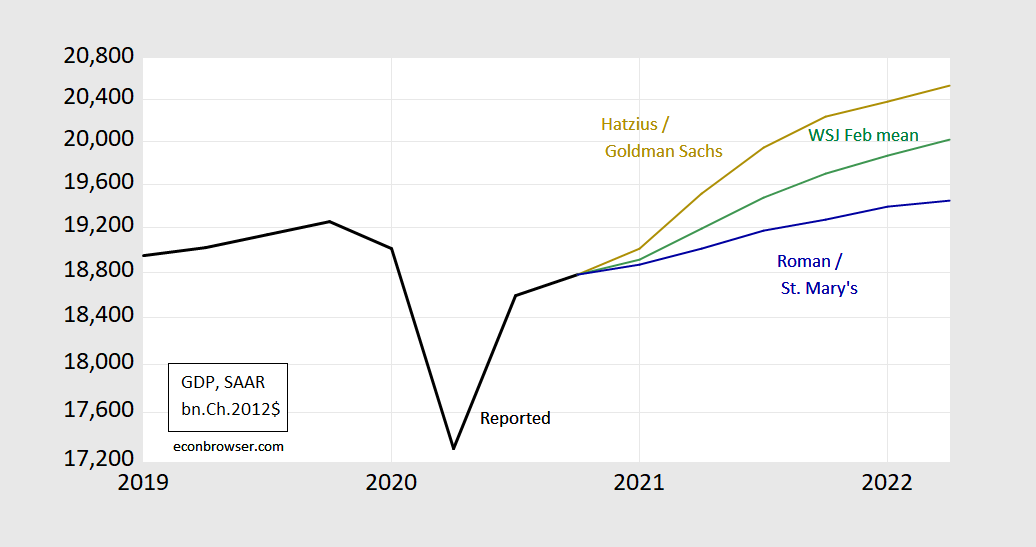
Figure 2: GDP (black), GDP forecast implied by WSJ February survey (green), Jan Hatzius/Goldman Sachs forecast (gold), Belinda Roman/St. Mary’s (blue), all in bn.Ch.2012$ SAAR. Source: BEA 2020Q4 advance, WSJ, and author’s calculations.
Disclosure: None.


