
How To Use Moving Averages To Buy Stocks

When it comes to trading stocks, it is important that traders know how to use indicators to enter and exit trades.
One key chart indicator, which day traders use to determine where stability lies, is the Moving Average (MA).
Moving averages are popular among day traders, investors, and technical analysts around the globe.
These people use moving averages on charts to help determine direction, strength, trend, and to find entry and exit points.
This article discusses what moving averages are, the different types, why they are important, and how day traders can use them to enter trades.
What are Moving Averages?
A moving average (MA) is a technical indicator that combines price points of a given instrument, such as a stock, over a specified time frame, and divides by the number of prices points to give you a single trend line.
Moving averages can be calculated for any sequential data set, including trading volume, highest and lowest prices, opening and closing prices, or any other indicators.
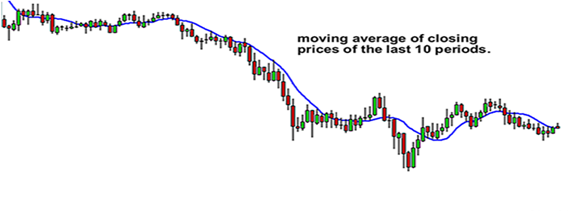
The following diagram shows how a moving average would look like on a chart:
As previously mentioned, MAs are popular among traders and technical analysts.
They rely on them to filter out the ‘noise’ and calculate the average value of a stock price over a specific period.
Moving averages can also help to determine the direction of the current trend while lessening the impact of random price spikes.
They are known as ‘moving’ because the introduction of new price points will replace old price points and ‘move’ the line on the chart.
Types of Moving Averages
There are four different types of moving averages, which we have explained below:
- Simple Moving Average (SMA)
Simple moving average, also known as an arithmetic moving average, is calculated by summing up a selected range of prices, usually closing prices, and then dividing the sum by the number of periods in that range.
This type of MA can help in determining if the price of a stock will go on or if it will reverse a bear or bull trend.
However, SMAs are not something you will likely have to calculate by hand as many charting tools and trading platforms will have them, and other moving averages built-in.
They show the average of closing prices for the time period they consider. Therefore, all price have equal value.
For instance, if you have a 20-day moving average, you will calculate a sum of 20 closing prices and divide it by 20. Each time a new closing price is formed, the oldest one is not counted anymore.
How to calculate a simple moving average
Here is a formula for calculating a simple moving average:
MA = (P1+P2+P3+P4+P5)/5
Here, P = Price.
Let us take the example of stock ABC.
In the last five trading days, the stock closed at the following prices:
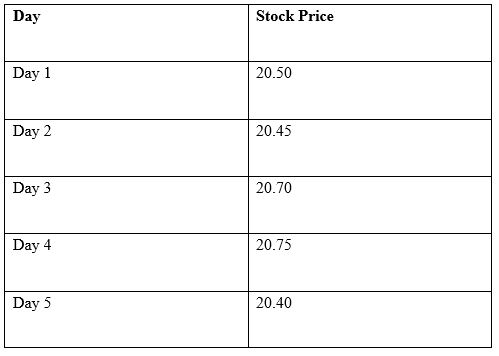
In the example above, the simple moving average of the stock price would be:
SMA = (20.50+20.45+20.70+20.78+20.40)/5
SMA = 102.80/5 = 20.56
Hence, the simple moving average of the stock price is 20.56.
After trading for another day, the latest closing price must be included in the calculation while the first price point (20.50 in this example) should not be considered.
Exponential Moving Average (EMA)
Exponential moving averages are calculated by taking the closing prices of the desired time period, but they are more heavily weighted on recent price action than the past action.
The benefit of EMAs is that they react faster to changes in price. Similar to simple moving averages, you can easily find these in your charting or trading platform.
Weighted Moving Average (WMA)
Similar to the exponential moving average, weighted moving averages put less weight on older closing prices, and more weight on recent closing prices.
However, WMAs are more easily customizable and are calculated differently.
Moving Average Convergence Divergence (MACD)
Moving average convergence divergence is a common technical indicator that is based on moving averages.
It measures the strength of a trend and uses two moving average prices. The MACD is the 12-period EMA minus the 26-period EMA.
Importance of Moving Averages
- They help reduce the amount of noise on a price chart: EMAs, WMAs, and SMAs help cut down the noise on trading charts by smoothing out the data that may show short-lived changes in price of a stock. This makes it easy to read and detect trends.
- MAs can be used to confirm uptrends and downtrends: If the price of a stock is higher than the moving average, it implies that the stock is trading higher during the specified period, on average.
If the price of a stock is lower than the moving average, this means that the stock is trading lower during the specified period, on average.
- They act as support or resistance: Some moving averages can also act like support or resistance lines. For example, 200-, 100- or 50-day averages may act as support or resistance lines. A support level is a barrier to price decrease, while a resistance level is a barrier to price increase.
- Can be combined with other indicators to create trade signals to use in your strategy: For example, if a short-term moving average crosses a long-term moving average, this forms a technical chart pattern known as a golden cross. Golden crosses are often seen as a potential for a major rally.
How you can use moving averages to enter trades
An easy way to use moving averages is to help you know the price trend of a stock. You can do this just by simply plotting a single moving average on your trading chart.
If price action appears to remain above the moving average, this is a sign that the price is in an uptrend.
When price action seems to remain below the moving average, it is an indication that price is in a general downtrend.
However, it is important to plot a couple of moving averages on your charts instead of just one.
This gives you a clearer signal of whether the stock is trending upward or downward depending on the order of the moving averages.
By combining moving averages with your knowledge on trend lines, you can help you decide whether to go short or long on a stock.
Bottom Line
Through the above article, we see that moving averages are an easy way to smooth out price action by filtering out the noise from random fluctuations. MAs are amazing if you know how to use them.
However, some traders often make disastrous mistakes when trading with moving averages.
But if you learn and know how to use the strengths of each moving average in each appropriate time, the results can always be good.
By analyzing the moving averages of a given stock, you can see the momentum or trend.
But before using this technical analysis indicator, traders also need to know the risks entailed.
Disclosure: This is not a recommendation to buy or sell any stock but is merely an informative article on different trading setups.


