How To Beat The Market In The Long Run With Trend Following Strategies
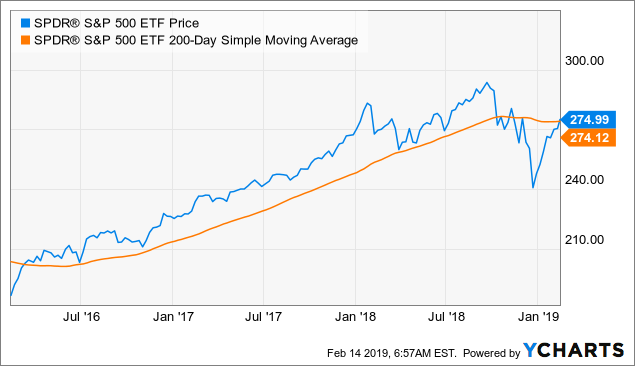
The SPDR S&P 500 ETF (SPY) - the ETF that tracks the widely popular S&P 500 index - closed above its 200-day moving average on Tuesday.
This is a widely followed trend indicator, and for good reasons. The data shows that making investment decisions based on such trend indicator can be remarkably effective at increasing returns and reducing downside risk.
Data by YCharts
However, even if trend-following on a single index works well in the long term, it can substantially underperform over several years. Implementing a trend-following strategy on multiple markets, sectors, and industries can produce superior returns in terms of both risk and reward.
How Trend Following Works On The SPDR S&P 500
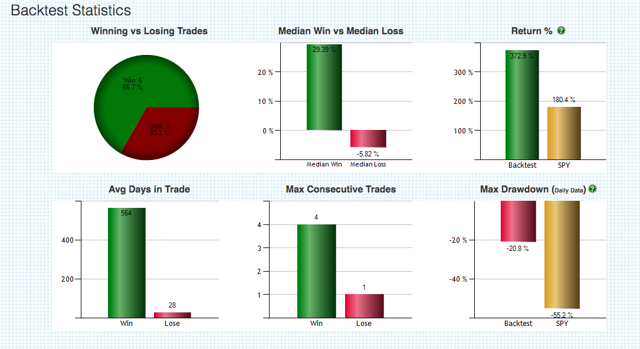
The following backtest is remarkably simple, it just buys the SPDR S&P 500 ETF when it's trading above the 200-day moving average (meaning that the ETF is un an uptrend). Conversely, if the ETF is below the 200-day moving average (meaning that it's in a downtrend) the strategy sells and goes to cash.
Source: ETFreplay
The performance statistics are outstanding. Since December of 1999, the trend-following strategy more than doubled the buy and hold strategy in SPDR S&P 500. Trend following gained 372.9% versus 180.4% for buy and hold.
Even more important, the maximum drawdown - meaning the greatest percentage drop in equity from the peak - was much lower. Trend following had a maximum drawdown of 20.8% versus 55.2% for buy and hold.
Source: ETFreplay
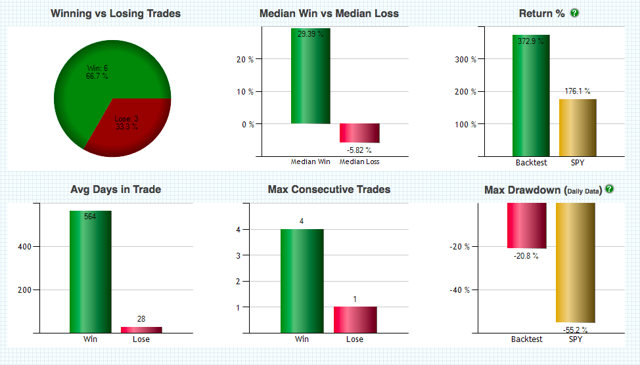
Since the year 2000, trend following delivered more than double the return with substantially less than half the drawdown than buy and hold.
However, it's important to acknowledge that the main reason for this spectacular outperformance is that the period under analysis includes two huge bear markets in 2001 and 2008.
A trend-following strategy protects your capital when markets start falling, so it can make an enormous difference when markets go through severe drawdowns.
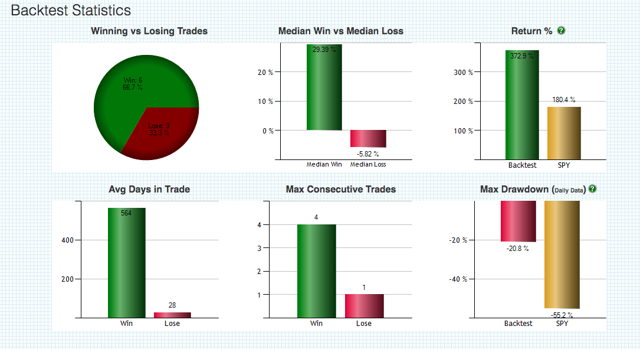
On the other hand, if we look at the backtesting data since January of 2009, trend-following significantly underperforms vs. buy and hold.
The trend following strategy made 175.3% versus 255.3% for buy and hold. Even if we consider the benefits of reduced downside risk, a trend following strategy leaves a lot of money on the table.
Source: ETFreplay
This is clearly because market pullbacks since 2009 have been relatively quick and shallow. When this happens, a small retracement is a buying opportunity for investors, as opposed to a reason to sell.
The main takeaway is quite evident. When markets go through big bull and bear periods, trend-following can make a huge positive difference. However, when bullish and bearish trends are weak, a trend following system should be expected to produce disappointing returns.
There Is Always A bull Market Somewhere
No quantitative system can be perfect or infallible. However, we can implement some modifications to a trend following strategy in order to improve performance in different scenarios. In particular, adding the benefits of diversification and relative strength to trend-following can be remarkably effective.
The Global Rotation System is updated every month in The Data-Driven Investor. It basically uses trend-following to choose between two portfolios: one based on different U.S. sectors and industries and another one based on global asset classes.
The sector portfolio includes 25 ETFs representing different sectors and industries in the U.S. stock market.
Those are:
- First Trust Dow Jones Internet Index (FDN)
- iShares Nasdaq Biotechnology ETF (IBB)
- iShares U.S. Oil Equipment & Services (IEZ)
- iShares North American Tech-Software (IGV)
- iShares U.S. Pharmaceuticals ETF (IHE)
- iShares U.S. Healthcare Providers (IHF)
- iShares U.S. Medical Devices ETF (IHI)
- iShares U.S. Aerospace & Defense (ITA)
- iShares U.S. Home Construction ETF (ITB)
- iShares US Industrials ETF (IYJ)
- iShares Transportation Average ETF (IYT)
- iShares US Technology ETF (IYW)
- iShares US Telecommunications ETF (IYZ)
- SPDR S&P Bank ETF (KBE)
- SPDR S&P Capital Markets ETF (KCE)
- SPDR S&P Insurance ETF (KIE)
- Invesco Dynamic Food & Beverage ETF (PBJ)
- Invesco Dynamic Media ETF (PBS)
- VanEck Vectors Semiconductor ETF (SMH)
- Vanguard REIT ETF (VNQ)
- Materials Select Sector SPDR Fund (XLB)
- Consumer Staples Select Sector SPDR (XLP)
- Utilities Select Sector SPDR Fund (XLU)
- SPDR Series Trust S&P Oil & Gas Exploration (XOP)
- SPDR Series Trust S&P Retail ETF (XRT)
The asset class portfolio covers 9 different asset classes on a global scale.
The ETFs in the universe are:
- SPDR S&P 500 (SPY) for big stocks in the U.S.
- iShares Russell 2000 Index Fund (IWM) for small U.S. stocks
- iShares MSCI EAFE (EFA) for international stocks in developed markets
- iShares MSCI Emerging Markets (EEM) for international stocks in emerging markets.
- PowerShares DB Commodities (DBC) for a basket of commodities
- SPDR Gold Trust (GLD) for gold
- Vanguard MSCI U.S. REIT (VNQ) for REITs
- iShares Barclays Long-Term Treasury (TLT) for long-term Treasury bonds
- Barclays Low Duration Treasury (SHY) for short-term Treasury bonds
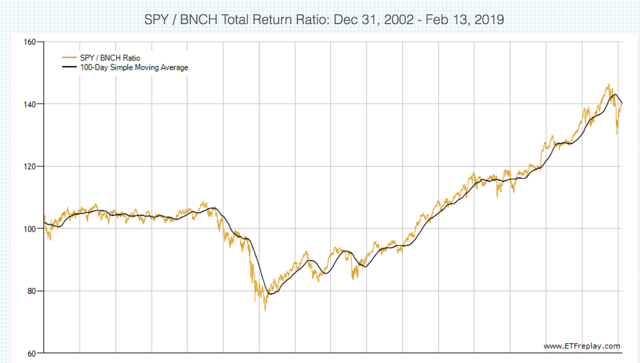
We can do this by creating a relative ratio that calculates SPY over BNCH. Then we measure the 100-day moving average in such ratio to tell if SPY is outperforming or underperforming the benchmark.
 Source: ETFreplay
In each portfolio, we use a relative strength ranking that measures risk-adjusted performance for the ETFs in such a portfolio over the middle term. This is calculated with a ranking system that compares volatility-adjusted returns over 3 and 6 months.
When the SPDR S&P 500 is outperforming the global benchmark the system is allocated to the top 3 ETFs with the highest relative strength in the U.S. sectors portfolio. On the other hand, if the S&P 500 is underperforming the benchmark, then the system is invested in the top 3 ETFs with the highest relative strength in the asset class portfolio.
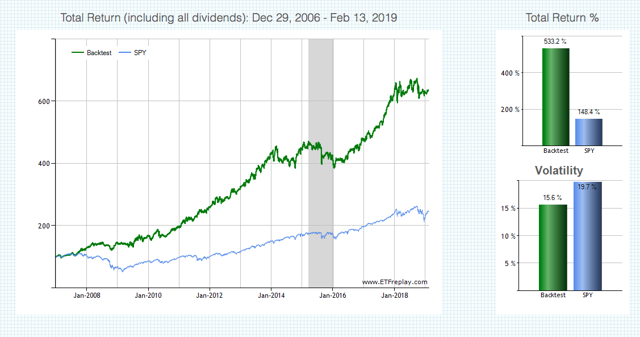
Since January of 2007, the Global Rotation System produced a cumulative gain of 533.2% versus 148.4% for the SPDR S&P 500 in the same period. In annual terms, the system gained 16.5% versus 7.8% for the SPDR S&P 500.
The system substantially outperformed the SPDR S&P 500 in terms of downside risk too. The maximum drawdown was 18.4% for the Global Rotation System versus 55.2% for the SPDR S&P 500 in the same period.
Source: ETFreplay.

Source: ETFreplay
Even if we measure only performance since January of 2009, the Global Rotation System outperforms. This is quite an impressive achievement, since the SPDR S&P 500 has been notoriously hard to beat in such a period.

Source: ETFreplay
The main point is that adding some diversification and relative strength to a trend following system can make a huge difference in terms of improving performance over the long term.
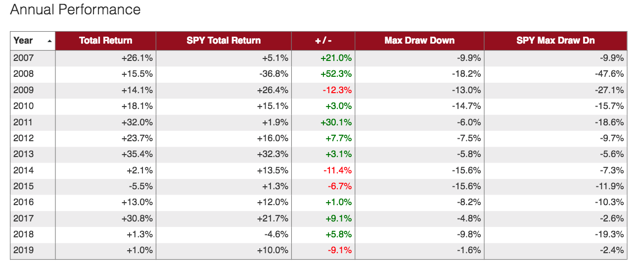
However, that does not mean that the system is immune to whipsaws and false signals in the short term. For example, in 2019, the Global Rotation System is up by only 1% versus a much larger gain of 10% for SPDR S&P 500. This is because the system was positioned for safety at the end of 2018, and then it underperformed as markets rallied in 2019.
Source: ETFreplay
In comparison to applying a simple trend following indicator on a single market index, a more elaborated system such as Global Rotation is far more robust and consistent, but it's performance still depends on the market environment.
The system should be expected to do well over the years, especially when there are well-defined trends, either up and or down in different markets. However, in a period in which trends are rapidly changing in direction, the system will probably produce mediocre performance overall.
Those limitations being fully acknowledged, the fact remains that implementing strategies based on trend following and relative strength can be a simple and effective way to optimize portfolio performance over the long term.
Disclosure: I have no positions in any stocks mentioned, and no plans to initiate any positions within the ...
more


