
How I Explain Crappy Returns
Diversification. It looks great on paper, but for the past ten years, being globally and “Factor” diversified has been anything but great. Understandably, many diversified investors are looking at their returns and wondering why they should follow such a strategy when the S&P 500 – which costs almost nothing – has performed so well.
To answer this question, let’s come back to my (our) general investment philosophy, which is “Factor” investing, also sometimes (and incorrectly) known as Smart Beta. The idea (backed by academic research, by the way) is that stock returns are driven by – or can be explained by – certain premiums.
The big ones are as follows:
- Market Premium
- The premium you earn for investing in stocks vs cash
- Small Premium
- The premium you earn for investing in small stocks vs large stocks
- Value Premium
- The premium you earn for investing in cheap stocks vs expensive/growth stocks
The idea is you can explain the returns of a stock portfolio by looking at how much it tilted toward small and/or value stocks. If it has no tilt at all – the S&P 500 – the portfolio should earn you the Market Premium. If it tilts toward small stocks, it should earn you the Market Premium plus part of the Small Premium depending on how far you tilted. If the portfolio tilts toward value stocks, it should earn you the Market Premium plus part of the Value Premium. And, finally, if it tilts toward small and value stocks, it should earn you the Market Premium plus part of the Small and Value Premiums.
When you look at the returns of active managers, what you find is that almost all of their portfolio returns can be explained by their tilts toward small and/or value, i.e. they’re not bringing anything to the table. They’re just tapping into those premiums and then claiming that it’s their “genius” that beat the market. Therefore, you shouldn’t use active managers since they don’t improve returns via skill.
The Market Premium Seems Fine. Why Add Complexity?
So, why would we want to tap into the Small and Value Premiums? Well, there are two good reasons.
First, they add diversification. You see, the Market Premium (the S&P 500) can go very long periods where it stinks. (By the way, the same is true of the Small and Value Premiums.)
For example, from 2000 to 2009, the U.S. Market Premium was -3.1% a year or -27.2% for the decade. That’s right, you earned significantly less than you would have earned by just holding cash. And in case you think that was just a weird anomaly, the U.S. Market Premium from 1966 to 1981 – 16 years! – was -0.28% a year.
Betting on the U.S. Market Premium alone is dangerous, which is why we add other premiums such as Small and Value. It’s also why we invest internationally, tapping into the International Market, Small and Value Premiums. Diversification.
For example, how did the U.S. Small and Value Premiums perform when the U.S. Market Premium was getting killed. Let’s look at the annualized returns:
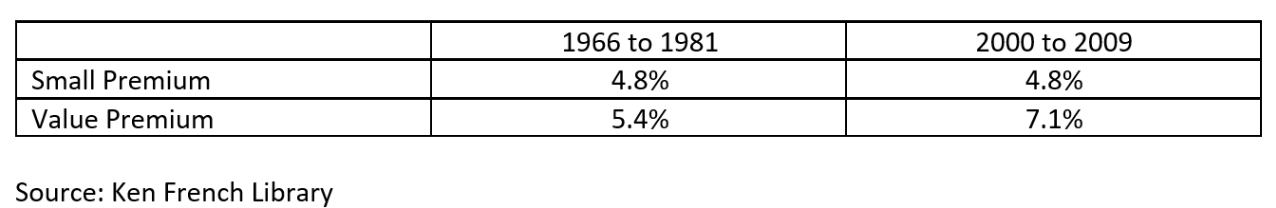
The results are hypothetical results and are NOT an indicator of future results and do NOT represent returns that any investor actually attained. Indexes are unmanaged, do not reflect management or trading fees, and one cannot invest directly in an index.
Wow. It was pretty nice having those other premiums around. Factor investing is about diversifying our sources of returns.
Now, the other reason that we might want to tap into the Small and Value Premiums is that they should – over the long run – improve our portfolio returns. Since the Small and Value Premiums are positive, adding them to the Market Premium should increase our returns.
Okay, this Factor Investing stuff sounds great, right. I mean, who doesn’t want better diversification and better returns. Well, not so fast. There’s a huge downside: There will be long periods of time where a Factor diversified portfolio will trail the overall market. When the Small or Value Premium – or heaven forbid, both – are negative, our portfolio will perform poorly. Tapping into negative premiums doesn’t help returns.
And that’s exactly what’s been happening for the past five (really, ten) years. Let’s take a look the annual U.S. and international Small and Value Premiums from 2015 to 2019 (smb is Small and hml is Value):
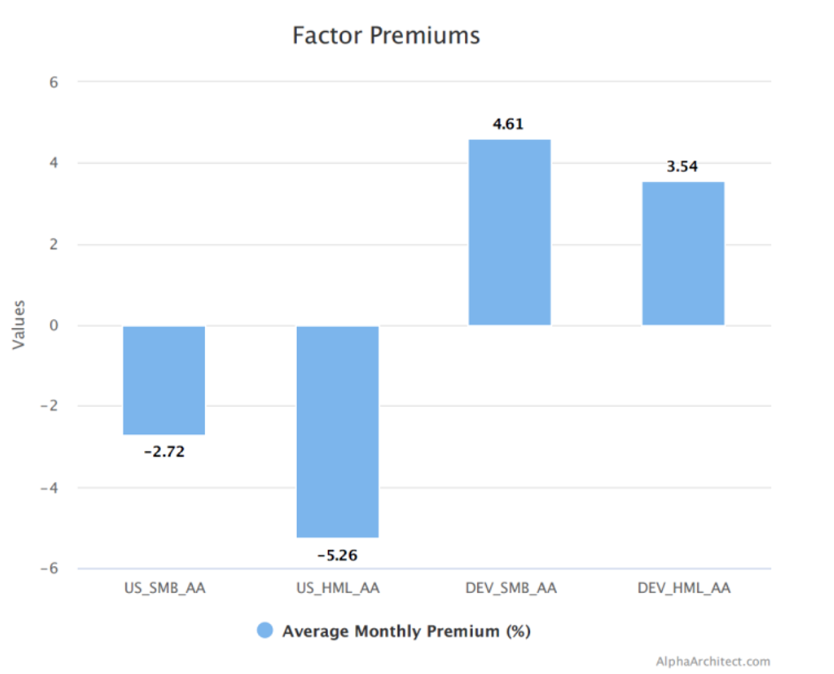
The results are hypothetical results and are NOT an indicator of future results and do NOT represent returns that any investor actually attained. Indexes are unmanaged, do not reflect management or trading fees, and one cannot invest directly in an index. Source: https://alphaarchitect.com/indexes/performance/#_premiums
It’s been a very tough run for both the Small and Value Premiums in the United States. Internationally, they’ve done pretty well. Let’s see how the factor returns translate into the returns for some of our mutual funds. First, let’s look at DFA’s small value fund (DFSVX) compared to the S&P 500 (the red line). We’d expect that the DFA fund’s returns would be lower, and, in fact, that’s exactly what you see. Actually, it’s really been the last couple of years that’s been the problem. Value (at least in the United States) has gotten destroyed since around mid-2018.
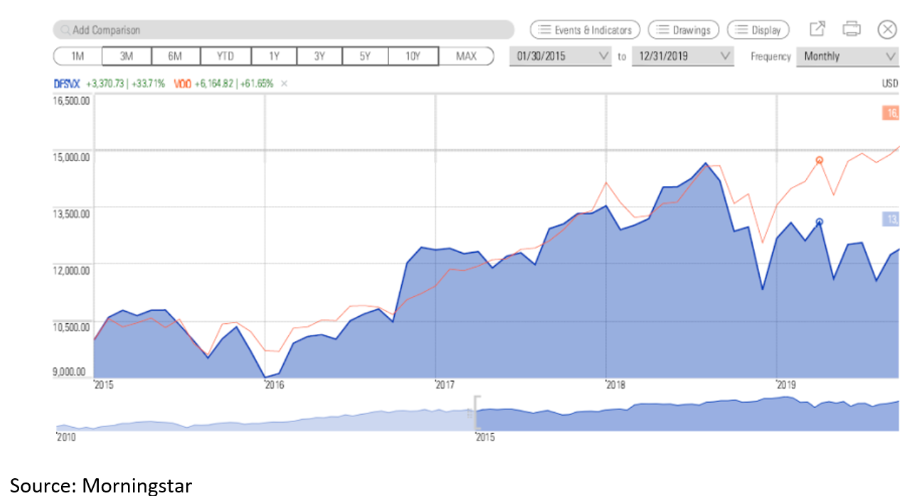
The results are hypothetical results and are NOT an indicator of future results and do NOT represent returns that any investor actually attained. Indexes are unmanaged, do not reflect management or trading fees, and one cannot invest directly in an index.
Now, let’s look at how DFA’s international small value fund (DISVX) has done compared to the overall international market. From the numbers above, we suspect that it should have done a bit better. And that exactly what we see.
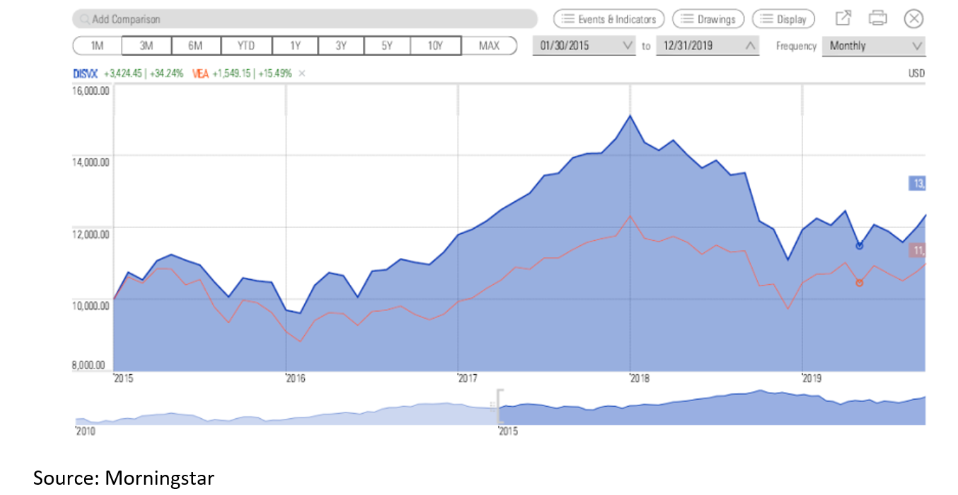
The results are hypothetical results and are NOT an indicator of future results and do NOT represent returns that any investor actually attained. Indexes are unmanaged, do not reflect management or trading fees, and one cannot invest directly in an index.
By the way, you’ll also notice that U.S. stocks – at least if you don’t own small value stocks – have done dramatically better than international stocks, i.e. the U.S. Market Premium has been significantly higher than the International Market Premium. Basically, the last five years have been extremely tough for the U.S. Small and Value Premiums as well as the International Market Premium. However, it’s been great for the U.S. Market Premium and pretty good for the International Small and Value Premiums. Diversification at work.
The Long-Term Factor Story
Now, let’s turn to how Factor investing works over various timeframes and why five – and even ten years – isn’t enough time to judge an investing strategy. First, let’s look at a Globally and Factor diversified portfolio that’s 60% stocks and 40% bonds (a general client portfolio) versus a generic 60% global stocks (i.e. no small or value tilts) and 40% bonds. We’ll start with rolling 5-Year returns beginning in 1999. 1
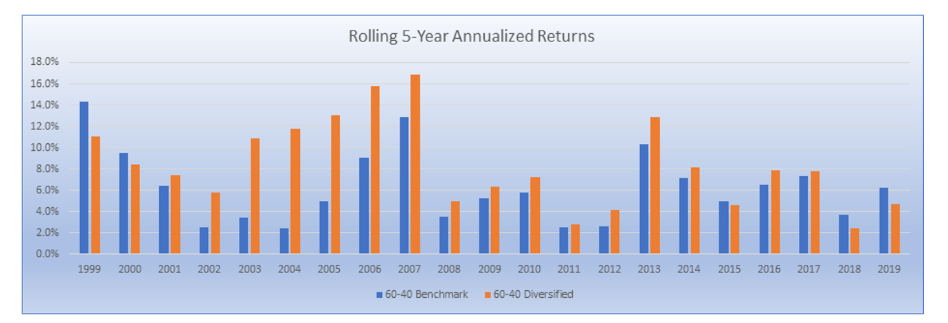
The results are hypothetical results and are NOT an indicator of future results and do NOT represent returns that any investor actually attained. Indexes are unmanaged, do not reflect management or trading fees, and one cannot invest directly in an index.
As you can see, the diversified portfolio generally outperforms over five years periods, but that’s certainly not always the case. The late 1990s and recently have been periods where factor investing has hurt. The last five or six years have been particularly painful because not only are we underperforming, but the absolute returns have been low as well. At least in the late 1990s, we were getting high returns, even if they weren’t as high as the generic portfolio.
Alright, let’s look at rolling ten-year returns. That’s better. The diversified portfolio almost never underperforms over a 10-year period – except, you guessed it – the last ten years. Yikes!
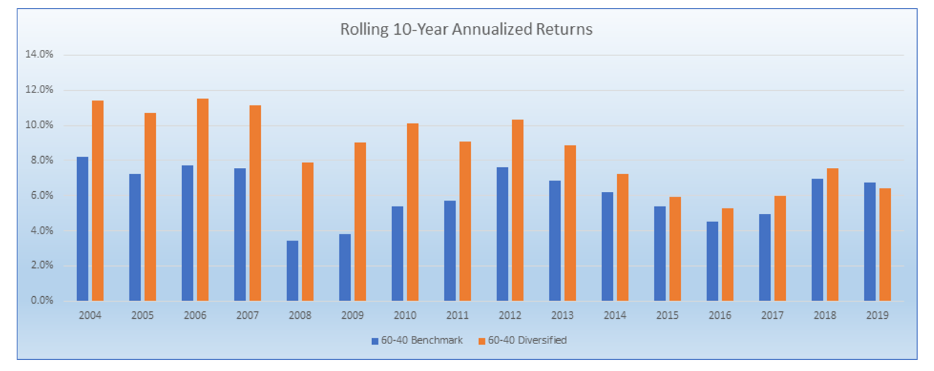
The results are hypothetical results and are NOT an indicator of future results and do NOT represent returns that any investor actually attained. Indexes are unmanaged, do not reflect management or trading fees, and one cannot invest directly in an index.
Finally, let’s look at rolling 15-year period returns. As you can see, the Factor diversified portfolio is both better and more consistent when we look at 15-year periods. Granted, these past 15 years have been close.
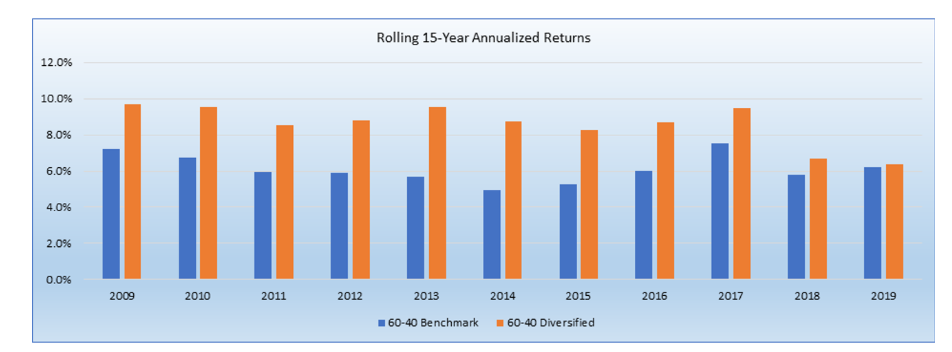
The results are hypothetical results and are NOT an indicator of future results and do NOT represent returns that any investor actually attained. Indexes are unmanaged, do not reflect management or trading fees, and one cannot invest directly in an index.
So, what does all of this tell us? First, it tells me that historically, factor investing both improves and smooths out our returns. Second, it tells me that five and, even, 10 years isn’t long enough to judge an investing strategy. Finally, it tells me that the past decade has been a particularly difficult period for factor investing.
Conclusion
Is Factor investing broken? Does Factor investing no longer work? Nobody can say for sure. I believe that it still works and that it has to go through difficult periods, or everyone would do it and, then ironically, it really would stop working.
Basically, for the past five or six years, our returns have been pretty crappy. However, we know why they’ve been crappy because small and value (and international stocks) have been crappy. Will small and value and international continue to be crappy. I don’t know. I do know that value stocks are cheap relative to history. I also know that international stocks are very cheap relative to U.S. stocks. Will that translate into better returns down the road relative to generic global stocks or to the S&P 500? Again, I don’t know, but history is on our side.
I also look at the 15-year rolling returns chart, and I find it very hard to bet against the diversified portfolio. That’s a pretty good track record.
However, to strengthen our fortitude when the market challenges us, we need to understand our investment strategy and understand where the returns come from – good and bad. It’s always been my belief that when it comes to investing, discipline – which is the key to investing success – comes through understanding. I hope all of this helps.
Notes:
-
- Benchmark Allocation
- 60% MSCI All Country World Index
- 20% DFA Intermediate Government Fixed Income
- 20% DFA Short-Term Government
- Diversified Portfolio
- 15% DFA Large Value
- 15% DFA Small Value
- 11% DFA International Large Value
- 11% DFA International Small Value
- 8% DFA Emerging Market Value
- Benchmark Allocation
Disclosure: Performance figures contained herein are hypothetical, unaudited and prepared by Alpha Architect, LLC; hypothetical results are intended for illustrative purposes only. Past ...
more

