
Housing Strong; ITB, Having Rallied To New High This Month, Tests Major Resistance – Unsuccessfully Thus Far
US housing is going gangbusters. Sales are very strong. Builder optimism is at a record. Starts have recovered strongly. Amidst all this, ITB, having risen to a new high this month, is running into massive resistance.
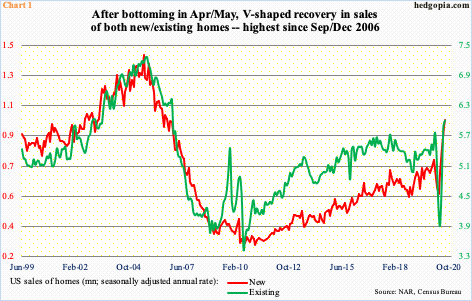
Housing activity has picked up steam the past several months. Earlier, as the US economy came under the grips of COVID-19, sales tumbled, with new homes reaching a 16-month low in April and existing homes lowest since October 2010 in May. Since then, sales have catapulted higher.
In August, sales of new and existing homes were up 77.4 percent and 53.5 percent from the April/May lows to a seasonally adjusted annual rate of 1.01 million units and six million units, respectively (Chart 1).
At the current pace, there are not enough homes available for sale. In August, there was three months’ supply in existing homes and 3.4 months in new.
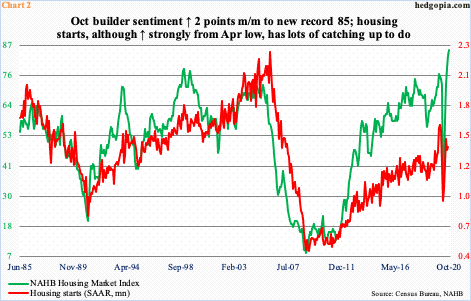
Homebuilders are very optimistic. The NAHB Housing Market Index this month rose another two points month-over-month to 85 – a new record. In April, builder sentiment was down to 30. From that low, it has gone straight up, nearly tripling (Chart 2).
Builders are actively breaking ground on new homes. In April, housing starts had tumbled to 934,000 units (SAAR). By July, they were clocking an annualized rate of 1.49 million, with September at 1.42 million.
This is quite an impressive recovery in starts, although they are yet to catch up with the surge in builder optimism.
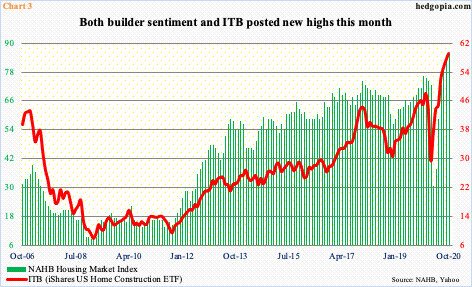
Housing stocks have responded. The leading names such as D.R. Horton (DHI), Lennar (LEN), PulteGroup (PHM) and NVR (NVR) all rallied to new highs this month. Ditto with ITB (iShares US Home Construction ETF).
Historically, the ETF tends to go hand in hand with builder optimism (Chart 3). This month, they both rallied to fresh highs.
Amidst all this, ITB has reached a potentially crucial price point.
For the year, it is up 32.4 percent. Those who bottom-ticked the March low are up 162.7 percent. Longs are sitting on tons of gains.
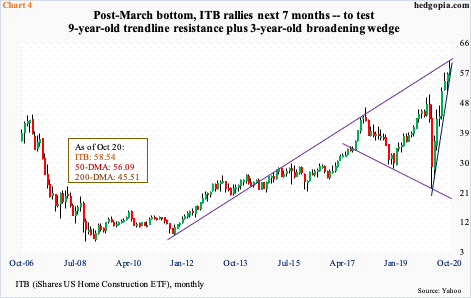
Back on February 21st, ITB peaked at $50.27. By March 18th, it had collapsed to $22.28. The rally that followed began to respond to constantly improving housing data. The February high was taken out on July 23rd. With eight sessions to go this month, it is up 3.3 percent and has rallied for seven straight months.
Last Friday, ITB tagged $60.87 before coming under slight pressure. That high essentially was a backtest of a nine-year-old trend line. This also lines up with a three-year-old ascending broadening wedge (Chart 4). Thus far, this resistance has held, with the month producing a candle with a long upper shadow.
Because the rally the past seven months has been so steep, it does not take long before ITB ($58.54) breaches a trend line from March. It is worth watching. Immediately ahead, there is support at $57-plus. The price action for nearly two weeks now is beginning to suggest longs are beginning to wonder if the current momentum in housing has staying power.
Thanks for reading!
Disclaimer: This article is not intended to be, nor shall it be construed as, investment advice. Neither the information nor any opinion expressed here constitutes an offer to buy or sell any ...
more

