
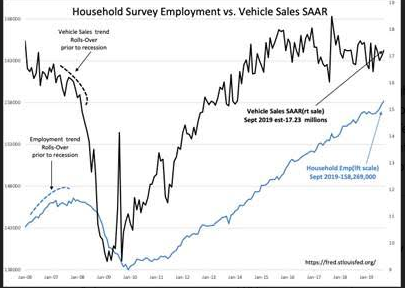
Household Survey Employment Adds 391,000, Vehicle SAAR 17.23M Units
“Davidson” submits:
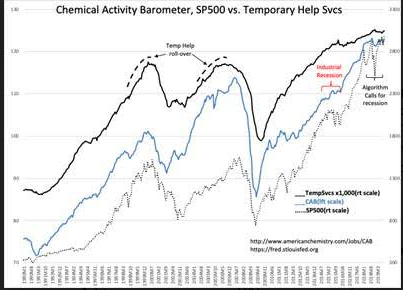
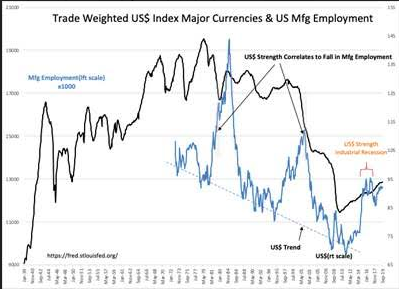
The Household Survey Employment adds 391,000 and Light Weight Vehicle SAAR is reported to be 17.23 mil units. CNBC called this “…terrible” and “…a mealy peach of a report, not great”. The data shows a continuation of the employment trend since 2009. With vehicle sales steady, these indicators characterize economic expansion. Temporary Help data shows it ticking higher which is in line with the Chemical Activity Barometer(CAB). Contrary to much of the current concern, manufacturing continues to expand even though recent US$ strength has slowed activity and slowed manufacturing employment gains.
(Click on image to enlarge)
(Click on image to enlarge)
(Click on image to enlarge)
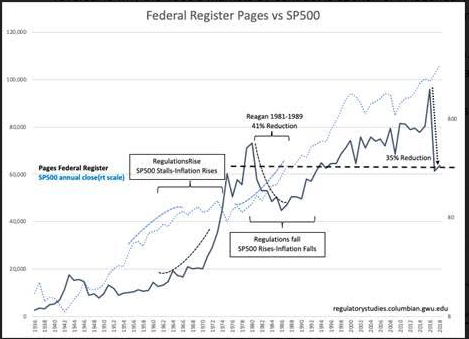
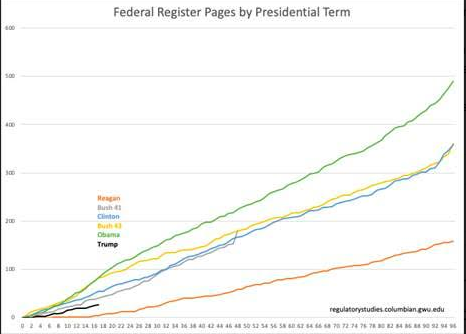
All economic indicators continue to confound those expecting a recession simply because we have never had an economic expansion of this length. They continue to believe based on previous market cycles that it is “… time for a recession” based on Modern Portfolio Theory trends. Missed in this analysis has been government policy shifts that have been significant. One of these has been the drop in the level of Federal regulation as measured by the number of pages in the Federal Register marking the level of Federal regulation. The history since 1936 vs SP500 has interesting correlations that provide insight to the current surprises in the current economic trends.
Of particular interest is President Reagan’s time in office. He was the first President to substantially lower Federal regulations. Correlated with Reagan’s actions was a period of strongly rising economic activity, falling inflation and a sharply rising SP500. The number of pages in the Federal Register fell by 41% which lowered to costs to businesses. It took Reagan 8yrs to accomplish and it occurred even as he added new regulations. The current administration has in 2yrs lowered Federal regulations by 35% as of yearend 2018. Federal Register pages have fallen to 1992 levels. The stated goal even as new regulations are added is to continue to lower total regulations. Policy shifts are only measurable after-the-fact as societies and businesses typically adjust to minimize their negative impacts. Market analysts seldom include consideration of policy outcomes till the economic impact is well defined. By the time it is obvious, market activity has long priced in developing shifts in economic trends.
(Click on image to enlarge)
(Click on image to enlarge)
That the current reduction in Federal regulation is likely to have continued and positive impact for investors can be seen when compared to the period 1965-1980. This was a period of rising Federal regulation, rising inflation and flattening SP500 performance. The Reagan reversal is why the 1980’s markets by contrast is spoken of in legendary terms. We appear to still be in the early stages of benefiting from the sharp fall in Federal regulations the last 2yrs. It is one reason many expecting recession have been so surprised.
All hard data economic indicators reflect continued economic expansion. It is only market psychology-based signals that are concerning investors. Many treat these as being valid economic signals when they are not.
Equity prices should trend higher once we move through the current pessimism. When this is likely to occur is impossible to predict. Market psychology has its own timeline.
Disclosure: The information in this blog post represents my own opinions and does not contain a recommendation for any particular security or investment. I or my affiliates may hold positions or ...
more

