
Home Price Growth Falls To The Lowest In 6.5 Years
If the housing market weakens further, which isn’t what we think will happen, there isn’t much room for it to fall. Housing starts can’t fall much because they haven’t risen much this cycle. As you can see from the chart below, the residential credit availability index is nowhere near its peak in 2006.
Pretty boring out here when they won't let strippers buy 5 houses pic.twitter.com/LWZtmPdf7P
— Nick (@NickatFP) April 29, 2019
We’ve seen the real residential component of GDP fall 5 straight quarters and the economy isn’t close to a recession. 2018 was a strong year, while Q1 2019 wasn’t that great for the overall economy.
There’s no doubt, rising interest rates and a weakening labor market would hurt housing. The housing market isn’t impenetrable; it just won’t crash the economy like it did last time, as we have discussed before at length. We know high interest rates would hurt housing just by looking at 2018 and those rates weren’t even high based on historical standards. A high unemployment rate would shrink demand for housing, but we’re waiting to see which catalyst can turn the labor market. The housing market leads the economy and has been weak for a few quarters. It’s an indicator, but won’t be a catalyst for changes to the economy.
Case-Shiller Home Price Growth Faulters
We discussed in a previous article that the February FHFA home price index showed house price growth was the lowest in 4 years. The February CoreLogic Case Shiller home price index showed even worse results. The 20 city composite index was up 0.2% month over month on both a seasonally and non-seasonally adjusted basis. On a non-seasonally adjusted yearly basis, growth was 3% which was down from 3.5% in January and missed estimates for 3.2% growth. This is the lowest growth rate since August 2012.
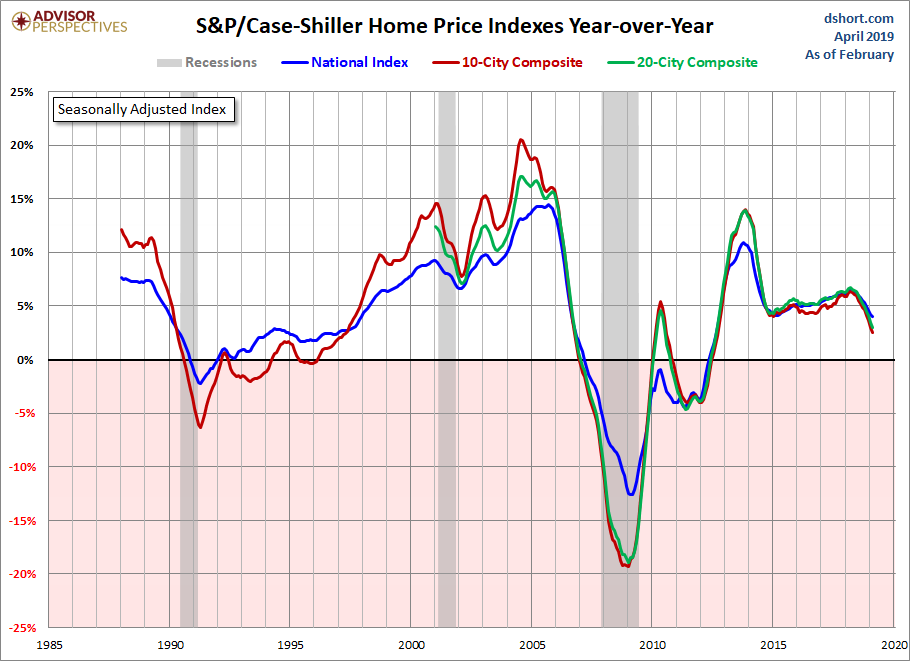
The seasonally adjusted national home price index was up 4% yearly as the chart above shows. With falling interest rates, housing started to become more affordable in some areas in a sequential basis. However, nationally, on a yearly basis, the situation actually got worse, although at a lesser rate. Average weekly earnings growth was 3.1% in February. That’s still below the national level price improvement. In February, 30 year rates averaged 4.37%. That’s down from the monthly peak of 4.87% in November, but actually 4 basis points higher than February 2018. Therefore, yearly house price growth was quicker than weekly wage growth and interest rates increased slightly.
The interest rate comparison will get easier later in the year, the tight labor market should push up nominal weekly wage growth, and home price growth could fall a bit more. Therefore, it’s fair to see a scenario later in the year where housing gets more affordable on a national level. Since the Case Shiller index is from back in February, housing could be at that point now. If you’re curious, in the past four weeks rates have risen as the 30 year mortgage rate increased from 4.06% to 4.2%. In March weekly wage growth was 3.2%.
Individual City Home Price Growth
The city by city results showed a continuation of the recent trends. Phoenix and Las Vegas have been the hottest markets recently. Seattle, Portland, and Denver have cooled off significantly. New York, Chicago, and Los Angeles have been weak for a while. Specifically, Los Angeles had a 0.1% monthly decline, and Portland and Seattle had a 0.1% monthly gain.
Disclaimer: Please familiarize yourself with our full disclaimer here.


