
Hindsight 2020
2020 RECAP
Historical analogs for 2020 asset class (and fund) performance are virtually non-existent. The speed by which many asset classes and economic activity deteriorated in the second quarter of 2020 is unprecedented. Value-at-risk models, ours included, were woefully unprepared for such a shock. It is during such Black Swan events that asset managers must be nimble, level-headed, and remain steadfast to their process in the face of fear and uncertainty. And while this might sound like a simple investing tenet, in practice it is much more difficult. This was my number one thought as I repositioned the portfolio, quarantined in my dusty attic, during the dark financial days of March. Repositioning the portfolio in such a difficult environment is difficult – there is no perfect formula. An asset manager has to consider all of the following: 1) investors may redeem their investment by choice, or by necessity. 2) positions that you want to sell may have no underlying bid. And 3) panicked markets will often take the positions you have conviction in to levels you never thought possible. With these problems in mind, I had to make a few choices. First and foremost, I treated the sell-off as a generational buying opportunity in many of the bonds that we already owned. Specifically, the Business Development Company debt, with 3 to 5-year maturities, once yielding 5%, was suddenly trading at 20-50% yields, depending on the issuer. Second, I had to maintain enough cash for potential redemptions so as to not be a forced seller at fire sale prices. And third, many of the positions I no longer had conviction in, due to the Pandemic, were impossible to unload, given that there were no bids. So, I made a choice: I sold all of our TIPS positions and virtually all of our AAA CLO positions to fund potential redemptions and BDC debt purchases. At times, I was selling AAA paper at 7-10% yields so that I could take advantage of the sell-off in my favored asset class. I also chose to spend my time and energy pursuing this rebalancing rather than wasting time finding buyers of the debt I no longer had conviction in, and was likely to be permanently impaired – mostly in the energy sector. Indeed, we ultimately had four issues go to non-accrual and eventually file for bankruptcy. But this was a problem I addressed after the volatile market of March and April, and by buying quality bonds at distressed prices, I was able to more than make-up for these impairments. In our Q1 Newsletter, “Coronavirus – Market Fear & Opportunities Abound,” I wrote: “I do not know how bad it gets and how long the disruption lasts. Historically, pandemic fears have typically shaved 10-20% off of equity markets, but there is always tail-risk and human reaction and fear can certainly have a cascading domino effect when it comes to asset prices. That is the bad news. The good news is that there is a global initiative currently underway that will provide fiscal and monetary stimulus to a problem that could be temporary.” My approach to the portfolio has been driven by the statement above, and has remained consistent. After publishing the newsletter, the referenced “bad news” was certainly apropos. The S&P 500 ultimately plunged 33.8% from its February highs, and the Holbrook Income Fund (ticker: HOBIX) experienced a drawdown of 23.36% from its highs. At the time I wrote the newsletter, it was only down 1.47%. Again, this speaks to the tail-risk inherent during a Black Swan event. But more importantly, my belief that monetary and fiscal policy would provide a bridge to a more normal economy never wavered. As such, while volatility soared, and drawdowns reached levels unforeseen and unexpected, our process did not change, only the scorecard. I referenced this process in the Q1 newsletter:
“We at Holbrook hate drawdowns, but we also recognize they are a natural part of investing and our experience is that at times of heightened volatility the best opportunities present themselves. As such, we will continue to deploy capital into a fear-based market. We have had a number of drawdowns since our inception on July 6, 2016 – most have been between 50 and 100 basis points. The current drawdown is more than that. Below is a chart showing our larger drawdowns and the subsequent 1-year return. In both of our previous larger drawdowns, we built out the yield on the portfolio in the issues where we saw beneficial risk/reward. Both drawdowns were recovered relatively quickly and the subsequent year produced robust returns. This is our process. We use volatility to our advantage and as an opportunity to increase the yield in the portfolio in the names we like. In 2016, we added to our preferred and high yield positions before and after the election. In late 2018, we added exposure to our BDC Baby Bond positions. And today, we are continuing to add exposure to our short-dated BDC Baby Bond positions, which we think are particularly attractive.”
The chart below is updated and shows our drawdowns and subsequent 1-year returns. The last recovery is incomplete (less than one year since the drawdown) and shows our return from March 23rd, 2020 to November 30th, 2020.

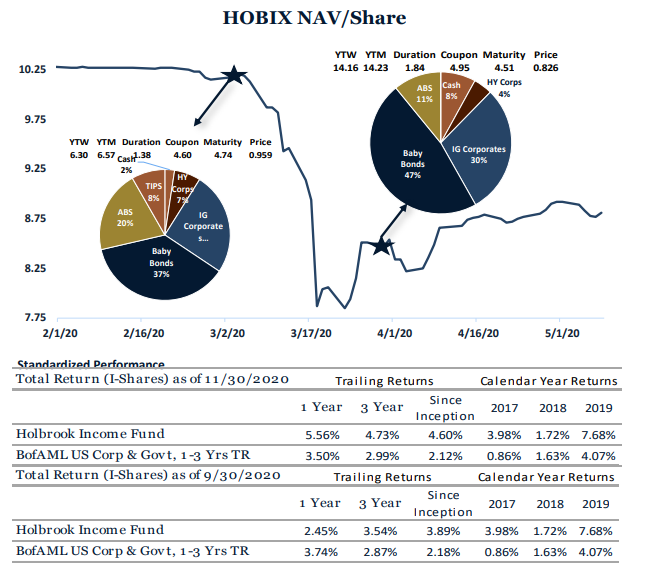
BofAML US Corporate & Government Index, 1-3 Year Index - The index tracks the performance of US dollar-denominated investment-grade debt publicly issued in the US domestic market, including US Treasury, US agency, foreign government, supranational and corporate securities, with a remaining term to final maturity less than 3 years. Past performance is not indicative of future results. Investors cannot directly invest in an index and unmanaged index returns do not reflect any fees, expenses or sales charges. Fund Inception is 7.6.2016 and performance is annualized. The performance data quoted here represents past performance. Current performance may be lower or higher than the performance data quoted above. Investment return and principal value will fluctuate, so that shares, when redeemed, may be worth more or less than their original cost. Past performance is no guarantee of future results. The total annual fund operating expenses for Class I are 1.17%. Total annual operating expenses after reimbursement of prior fees waived for Class I are 1.31%. The Fund's adviser has contractually agreed to reduce fees and absorb expenses of the Fund until at least September 1, 2021. Without these waivers the Total Annual Fund Operating Expense are 1.17% for Class I. Please review the Fund's prospectus for more detail on the expense waiver. Results shown reflect the waiver, without which the results could have been lower. A Fund’s performance, especially for very short periods of time, should not be the sole factor in making your investment decisions. For performance information current to the most recent month-end, please call toll-free 1-877-345- 8646. The figure below illustrates how we restructured the portfolio during the volatile March period (portfolio statistics are from the end of February to the end of March). The weighted average yield on the portfolio increased from 6.57% to 14.23%. The weighted average price of the portfolio decreased from 95.9 to 82.6 (percentage of par value). TIPS positions were sold, and AAA and AA CLO’s were pared for liquidity. Our Baby Bond exposure increased from 37% to 47% of the portfolio.
BofAML US Corporate & Government Index, 1-3 Year Index - The index tracks the performance of US dollar-denominated investment-grade debt publicly issued in the US domestic market, including US Treasury, US agency, foreign government, supranational and corporate securities, with a remaining term to final maturity less than 3 years. Past performance is not indicative of future results. Investors cannot directly invest in an index and unmanaged index returns do not reflect any fees, expenses or sales charges. Fund Inception is 7.6.2016 and performance is annualized. The performance data quoted here represents past performance. Current performance may be lower or higher than the performance data quoted above. Investment return and principal value will fluctuate, so that shares, when redeemed, may be worth more or less than their original cost. Past performance is no guarantee of future results. The total annual fund operating expenses for Class I are 1.17%. Total annual operating expenses after reimbursement of prior fees waived for Class I are 1.31%. The Fund's adviser has contractually agreed to reduce fees and absorb expenses of the Fund until at least September 1, 2021. Without these waivers the Total Annual Fund Operating Expense are 1.17% for Class I. Please review the Fund's prospectus for more detail on the expense waiver. Results shown reflect the waiver, without which the results could have been lower. A Fund’s performance, especially for very short periods of time, should not be the sole factor in making your investment decisions. For performance information current to the most recent month-end, please call toll-free 1-877-345- 8646.
Read more here.
Disclosure: This article is distributed for informational purposes only and should not be considered investment advice or a recommendation of any particular security, strategy or investment product. ...
more

