
Heikin Ashi Candlesticks Explained For Beginners

Most day traders prefer to use candlestick charts for their analysis, but most have not heard of the Heikin Ashi candlesticks.
Heikin Ashi candlesticks have recently gained popularity by day traders to identify a given trend more easily.
They look pretty similar to Japanese candlesticks at the first glance, but there are still some significant differences between them.
In this post, we are going to discuss Heikin Ashi candlesticks, how these modified candlesticks work, and how you can use them to give you a different unique perspective and maybe change the way perform your chart analysis.
What are Heikin Ashi candlesticks?
Heikin Ashi (sometimes spelled Heiken Ashi candlesticks) are a special type of Japanese candlesticks that are calculated from a combination of current and previous session’s price data.
The term “Heikin Ashi” simply means “average bar” in Japanese. Heikin Ashi charting technique was developed in the 1700s by a Japanese trader called Munehisa Homma.
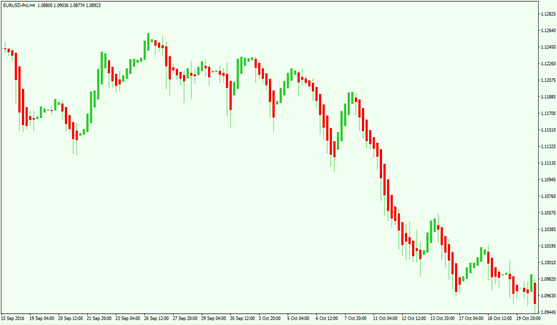
If you look carefully at the Heikin Ashi candlestick chart above, you can see is similar to a normal Japanese candlestick but the open and close are calculated differently.
Heikin Ashi looks very similar to the usual Japanese candlesticks, but there are some differences between the two.
One of the most obvious differences between Heikin Ashi charts and Japanese candlesticks is the calculation of the opening and closing prices.
Instead of using the current bar’s open, high, low, and close to build the bar, Heikin Ashi candlesticks are formed by combining the midpoint of the previous bar with the open, high, low, and close of the current bar.
A green bar means the average closing price of the previous six bars is in the higher 50% of its range, indicating a bullish bias. The opposite is true of the red bars.
Importance of Heikin Ashi candlesticks
Heikin Ashi charts make candlestick charts more readable for traders who want to know when to get out of a trade when the trend weakens and when stay in and ride a strong trend.
They are a modified way of displaying data on your candlestick chart, most notably the ability to smooth out the volatility of a stock or other financial instruments, allowing traders to build more complex trading strategies.
Typical candlestick charts will both display how volatile the markets were in a particular candlestick itself and the overall trend.
Heikin Ashi charts filter the noise and smooth out the price action on a chart by showing values using averages to create something that looks very similar to the candlestick.

How to calculate the Heikin Ashi candlestick
As previously mentioned, Heikin Ashi candlesticks are based on price data from the current close-open-high-low (COHL), the current Heikin-Ashi values, and the previous Heikin-Ashi values.
Here is a quick breakdown of how to calculate the Heiken Ashi candlestick:
- The Heikin Ashi Close is simply an average of the open, high, low, and close for the current period.
Close= ¼ (Open+Close+Low+Close)
- The Heikin Ashi Open is the average of the previous Heikin Ashi candlestick open plus the close of the previous Heikin Ashi candlestick.
Open= ½ (Open of Prev. Bar+Close of Prev. Bar)
- The Heikin Ashi High is the maximum of three data points.
High = (High, Open, Close)
- The Heikin Ashi low is the minimum of three data points.
Low = (Low, Open, Close)
How to use Heikin Ashi candlesticks
Now that you know how Heikin Ashi candlesticks look and how they are calculated, it is time to learn how you can apply them to your trading.
Heikin Ashi charting technique can be used to spot trend reversals or potential trends. This indicator takes into context several bars and not just a single bar.
Traders can use a group of bars to confirm a trend change, rotation from a bearish bias to a bullish bias, and vice versa. A single bar can be an anomaly.
And changes from short-range to long-range candles ones with tails or wicks on both sides can indicate indecision or uncertainty.
This could happen during a pullbacks and during turning points.
Here are five basic ways to use Heikin Ashi charts in your trading:
- When a Heikin Ashi candlestick change from red/black to green/white, it is a sign that price might be about to go up. If you are currently in a short position, it would be better to exit. If you are currently in a long position, it would be better to add to your position.
- If you see a lot of green candlesticks with no lower wicks or shadows, you will see a strong uptrend. Ride the rally as long as no lower wicks appear and let your profits run.
- Heikin Ashi candlesticks with small bodies showing lower and upper shadows indicate a possible trend pause (or trend reversal).
- When a candlestick changes from green/white to red/black, it is a sign that price might be about to go down. If you are currently in a short position, it would be wise to add to your position. If you are currently in a long position, it is better to exit.
- If you see a lot of red candlesticks with no upper wicks or shadows, you will see a strong downtrend. Stay short and until candlesticks change color, from red/black to green/white.
Limitations of Heikin Ashi
Just like any other technical analysis tool, Heikin Ashi are useful but they do have some limitations or weaknesses.
For example, the candlesticks do not show the exact open and close prices for a particular time period because they are averaged.
Second, the candlesticks obscure actual price information such as the actual closing price which is considered important by many traders.
Additionally, since these candlesticks require price information from two periods, they may not be responsive enough for scalpers or day traders.
Bottom Line
Heikin Ashi candlesticks are a compelling alternative to traditional Japanese candlestick charts. These candlesticks are essential in identifying market trends, making them well suited to day traders, scalpers, and swing traders.
Traders can use these modified candlesticks with any market on any time frame. If you familiarize yourselves with Heikin Ashi candlesticks, you can use them to help determine trends and trend reversals in different financial markets.
Heikin Ashi can also be applied to a wide range of trading strategies such as swing trading and day trading.
Disclosure: This is not a recommendation to buy or sell any stock but is merely an informative article on different trading setups.


