
Peek Into The Future, How Are Hedge Funds Are Positioned?
10-year note:
Currently net short 398.9k, up 40k.
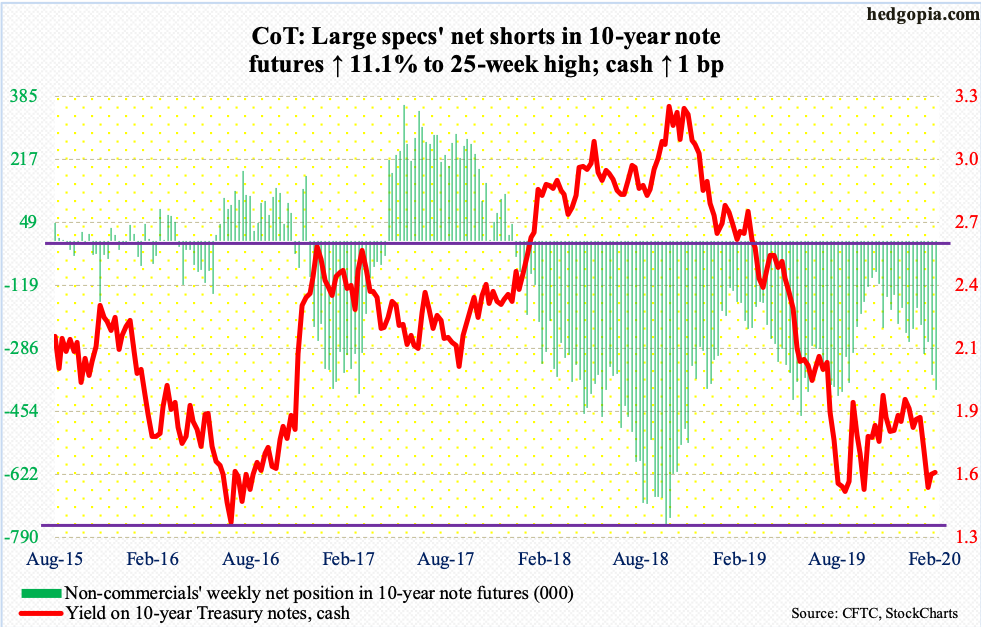
The Fed for all intents and purposes has been preparing the markets for more liquidity to come.
Since late September last year, SOMA (System Open Market Account) holdings have gone up by $258.1 billion, to $3.81 trillion.Back in April 2017, these holdings peaked at $4.24 trillion, up from under $500 billion pre-2008/2009 financial crisis.
This balance-sheet expansion coincided with three 25-basis-point cuts in the fed funds rate in the second half last year to a range of 150 to 175 basis points.The conventional monetary quiver lacks sufficient arrows to deal with potential weakness in the economy.To quote Jerome Powell, Fed chair, from his Humphrey-Hawkins testimony this week, “Some of the uncertainties around trade have diminished recently, but risks to the outlook remain.”
Powell also made it clear that, should the need be, the Fed will resort to large-scale asset purchases – the like of which was witnessed during QE1/2/3.They are playing the wealth effect card – push up the prices of assets such as equities, and through that, positively impact consumer sentiment/spending and the economy.
Thus far, it has worked.This in and of itself is no guarantee that it will work forever.The nightmare scenario is when the Fed continues to expand its balance sheet and stocks stop responding.
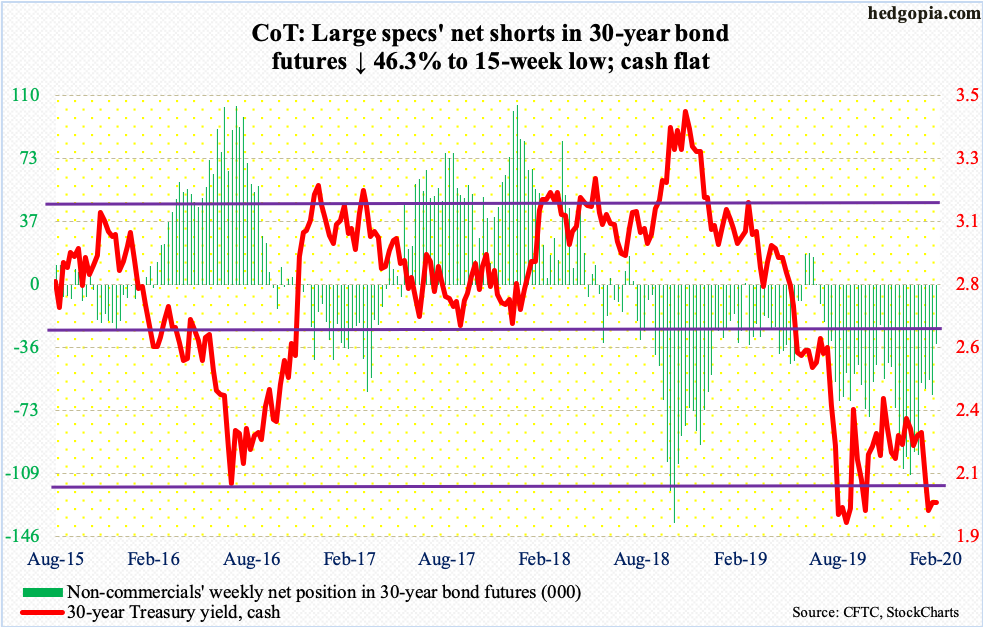
30-year bond:
Currently net short 34.3k, down 29.5k.
Major economic releases next week are as follows.Markets are closed Monday for observance of Presidents Day.
The NAHB housing market index (Feb) and the Treasury International Capital data (December) come out Tuesday.
Home builder sentiment fell a point month-over-month to 75 in January.Last December’s 76 was the highest since 77 in June 1999.
On a net basis in November, foreigners sold $41.8 billion in U.S. equities.This looks bad on the surface, except for the fact that the trend has substantially improved, as last April they were selling $214.6 billion worth – a record.
Wednesday has on tap the PPI (January), housing starts (January) and FOMC minutes (January 28-29 meeting).
In December, both producer prices and core PPI ticked up 0.1 percent m/m.In the 12 months to December, they respectively rose 1.3 percent and 1.5 percent.
Housing starts jumped 16.9 percent m/m in December to a seasonally adjusted annual rate of 1.61 million units – a 13-year high.
Existing home sales (January) are due out Friday.December sales rose 3.6 percent m/m to 5.54 million units (SAAR).The cycle high 5.72 million was hit in November 2017.
WTI crude oil:
Currently net long 611.6k, up 3.8k.
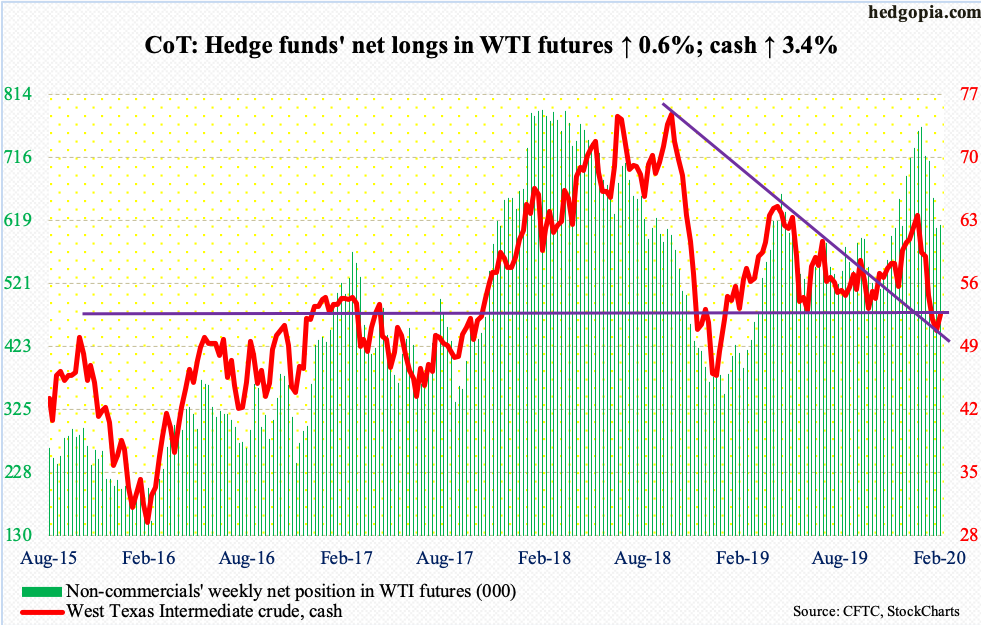
Citing coronavirus uncertainty as a major factor, OPEC Wednesday lowered its 2020 global crude oil demand by 200,000 barrels/day.This likely bolsters a case for production cuts.OPEC wants deep cuts, but Russia says it needs more time to decide.
The cash ($52.05/barrel) rallied 3.4 percent this week – first positive week in six.The EIA report for the week of February 7, which was not the best report, was unable to hurt traders’ sentiment.U.S. crude production, imports and stocks all rose – up 100,000 b/d, 363,000 b/d and 7.5 million barrels to 13 million b/d, seven mb/d and 442.5 million barrels respectively.However, gasoline and distillate stocks respectively fell by 95,000 barrels and two million barrels to 261 million barrels and 141.2 million barrels.Refinery utilization rose six-tenths of a percentage point to 88 percent.
After a one-month, 25-percent drop, WTI went sideways for a couple of weeks, which could be part of a base formation.Intraday Thursday, buyers showed up at the 10-day moving average, which is now flattish.There is room to rally, but bulls cannot afford to lose $50-51.
E-mini S&P 500:
Currently net long 34.8k, down 11.3k.
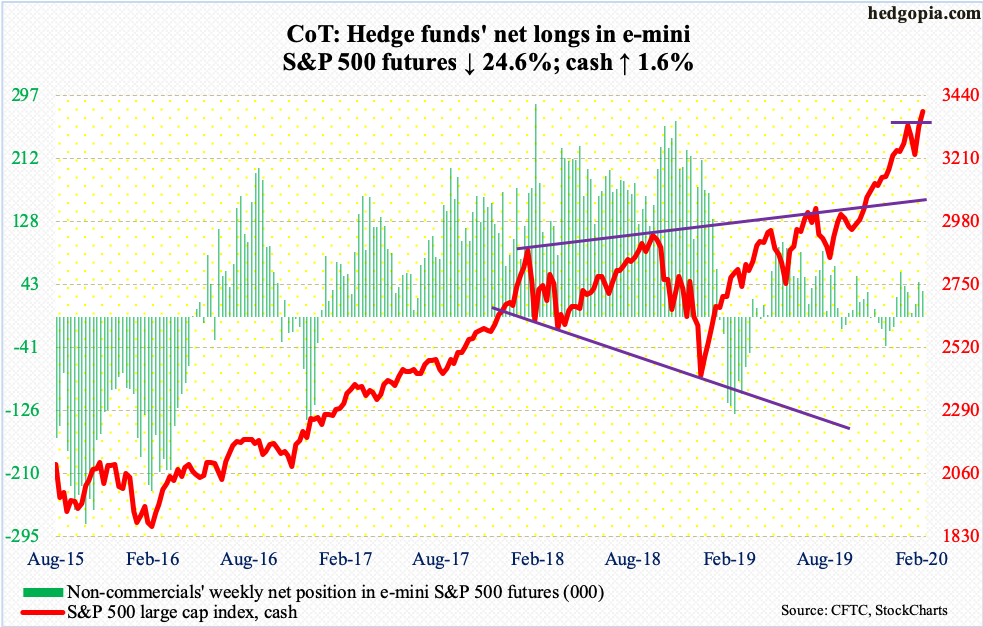
Flows continued to cooperate.After inflows of $10.7 billion in the prior week, SPY (SPDR S&P 500 ETF), VOO (Vanguard S&P 500 ETF) and IVV (iShares Core S&P 500 ETF) together took in another $4.7 billion in the week to Wednesday (courtesy of ETF.com).In the same week, US-based equity funds gained $4.8 billion (courtesy of Lipper); this followed inflows of $3.4 billion in the preceding week.
On the heels of last week’s 3.2-percent jump, the cash (3380.16) rallied another 1.6 percent this week.Thursday, it rose to a new intraday high of 3385.09.If one has to nitpick, it is that the daily RSI this time around has been unable to push into the 70s, and volume has subsided.The daily once again has been pushed into extended territory.Nearest support lies at 3330s.
Euro:
Currently net short 85.7k, up 10.6k.
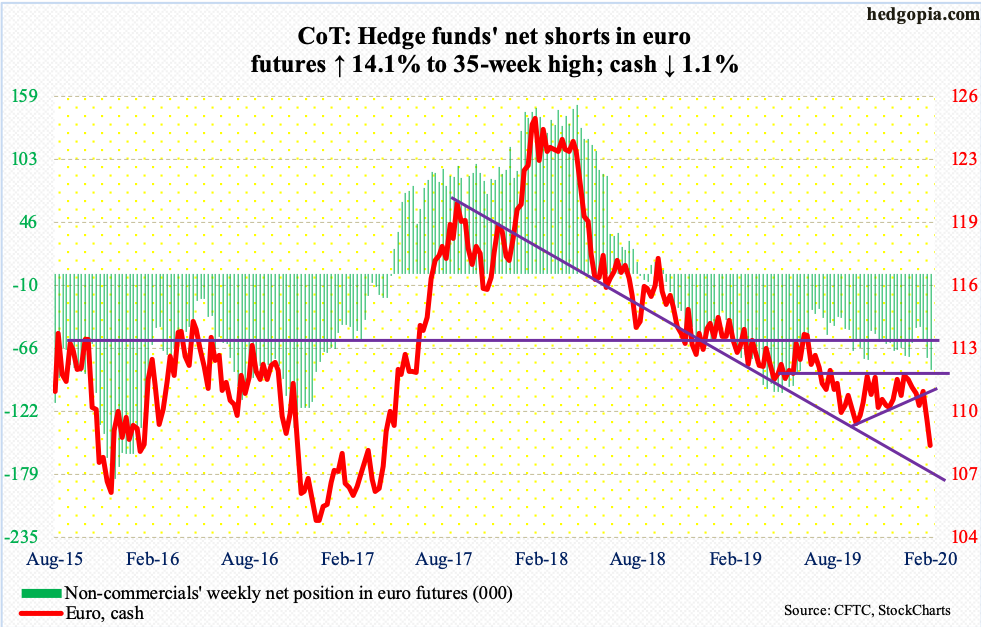
After losing straight-line support just south of 110 last week, the downward momentum continued this week – for a back-to-back weekly red marubozu candle.The cash ($108.26) lost 1.1 percent, with Friday’s intraday low the lowest since April 2017, past the intraday low of $108.85 from last October.
Recession fears in Germany are growing, and with that trader expectations for more easing/stimulus from the ECB.Between March 2015 and January 2017, the euro formed a major bottom at $104-105.Bears probably are now eyeing that level – timing notwithstanding.
Gold:
Currently net long 308k, up 8.2k.
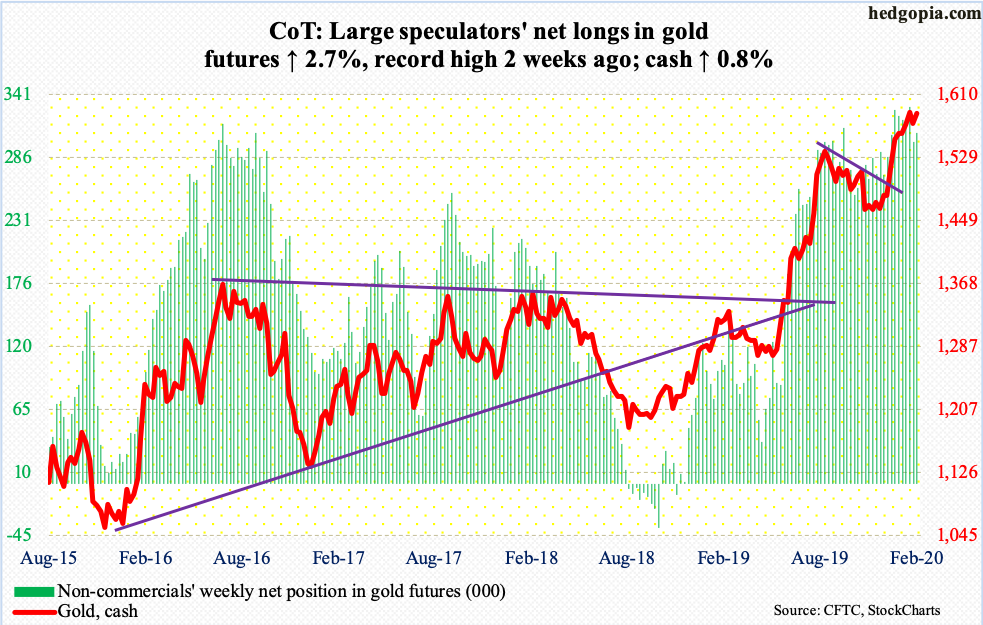
In the week to Wednesday, IAU (iShares Gold Trust) drew $93 million and GLD (SPDR Gold ETF) $370 million (courtesy of ETF.com).In the prior three, the latter gained $1.9 billion.
The cash ($1,586.40/ounce) has not made much progress for six weeks now.On January 8, gold reversed after printing $1,613.30 intraday.A couple of sessions before that, the metal broke out of $1,550s-60s, a crucial price point going back to April 2011.From gold bugs’ perspective, the good thing is that the sideways action is taking place above this resistance-turned-support.Plus, the yellow metal is holding its own even as stocks are rallying hard.
Nasdaq 100 index (mini):
Currently net long 8.7k, down 12.6k.
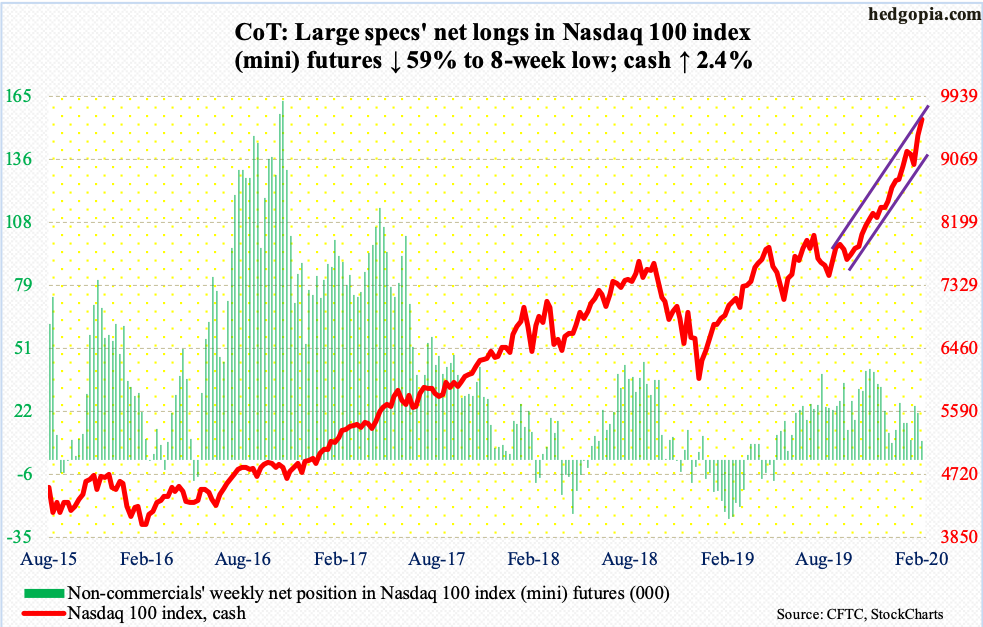
After rallying the cash (9623.58) 4.6 percent last week, bulls continued to dominate action.This week, the Nasdaq 100 added 2.4 percent to a fresh intraday high of 9636.41.It is possible more Nasdaq shorts gave up.At the end of January, Nasdaq short interest dropped two percent period-over-period to a six-month low but remains elevated (chart here).
In the meantime, QQQ (Invesco QQQ Trust) pulled in another $1.7 billion in the week to Wednesday (courtesy of ETF.com).In the prior two, it gained $1.1 billion.Nothing like rising price to ignite buying interest.
February is already up seven percent.If this holds, the Nasdaq 100 would have rallied for six straight months.From the lows of early October last year, it is up just short of 29 percent.Euphoria rules.At the same time, upward momentum is strong, and until it is broken, bears keep getting gored.
Nearest support lies at 9300.
Russell 2000 mini-index:
Currently net long 39.9k, down 13.5k.
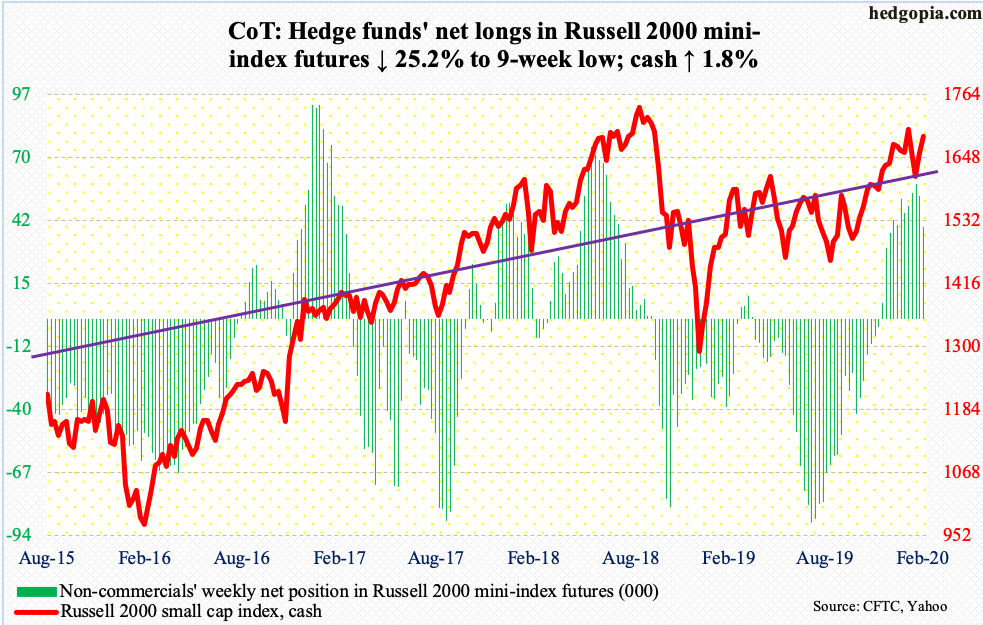
Small-caps are at an interesting juncture.The cash (1687.58) has lagged the S&P 500 for a while now, with a ratio between the two under pressure since June 2018.Monday’s low of 0.498 was the lowest since August 2004, with Friday at 0.499.The ratio is right at a falling trend line from that high (more on this here).
This is taking place even as bids are showing up around 1680s, which has acted as a ceiling for a month and a half.Just above lies the January 17th intraday high of 1715.08, which also approximates the underside of a broken trend line from last October.A breakout opens the door to a test of the all-time high of 1742.09 from August 2018.
For things to evolve this way, small-caps really need to outperform their large-cap peers.Only then will the ratio sustain higher.Else, just north of 0.51 lies broken trend-line resistance from early September last year.As things stand, this likely holds.
In the week to Wednesday, IWM (iShares Russell 2000 ETF) attracted $10 million, while IJR (iShares Core S&P Small-Cap ETF) saw no activity whatsoever (courtesy of ETF.com).
US Dollar Index:
Currently net long 19.5k, up 2.4k.
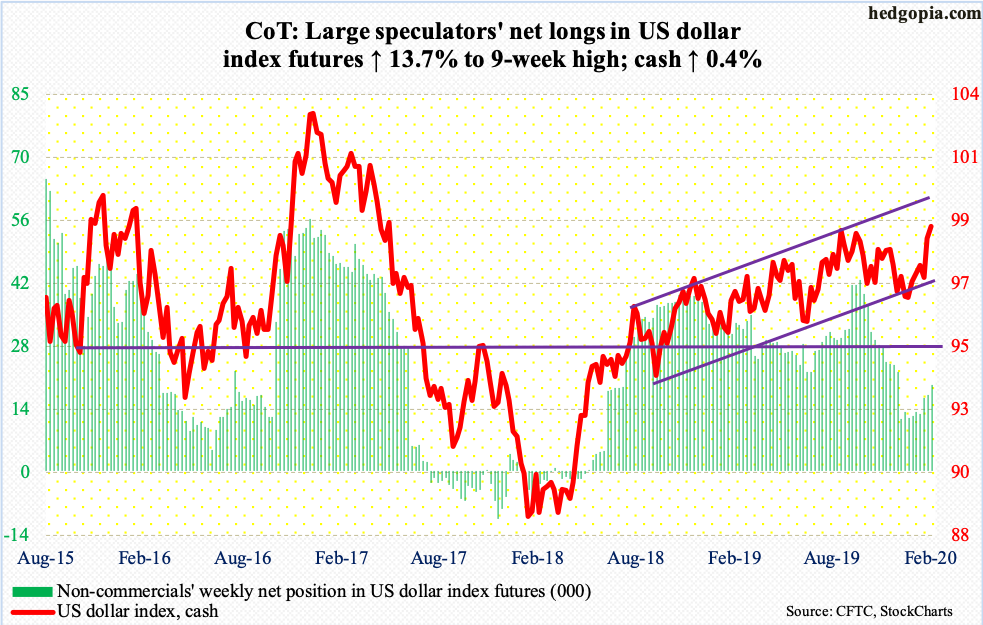
The cash (99) is trying to break out.Within a month between September and October last year, 99.30s was tagged twice.The drop since bottomed at 96.02 late December.Once again, dollar bulls are hammering on this, rallying all along the sharply rising daily upper Bollinger band the past eight sessions.A breakout opens the door to a test of one-and-a-half-year channel resistance at 100.20s.
The daily is extended.Provided weakness develops, near-term support lies at 98.30s.
VIX:
Currently net short 130.9k, up 13.7k.
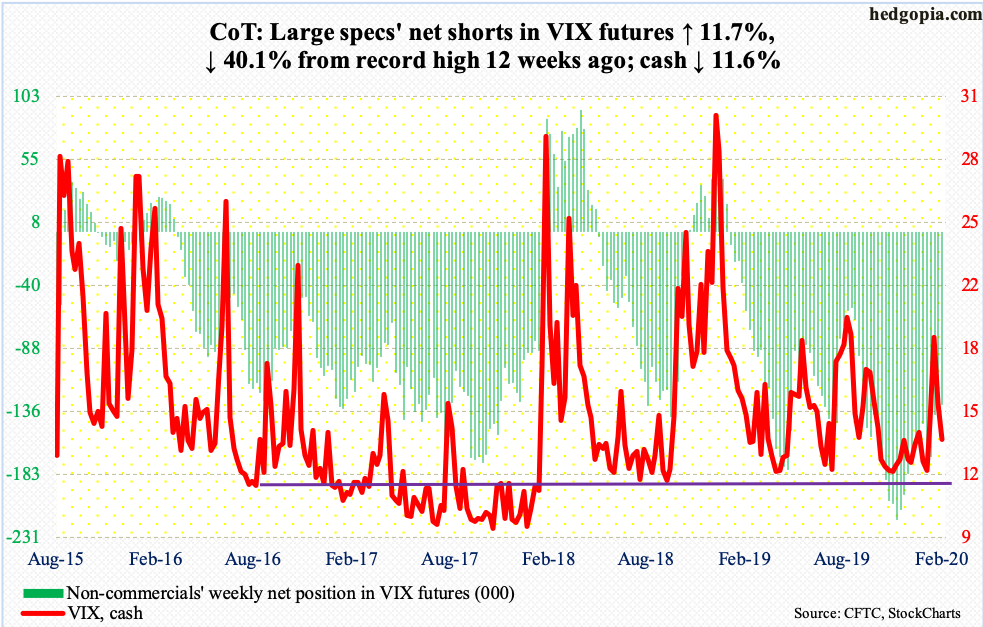
Several weekly indicators such as the RSI and CCI are approaching the median.This is as good a place as any for volatility bulls to take a stand.Also, on the daily, the cash (13.68) is just under the 50-day (14.04), which approximates a falling trend line from last August when VIX peaked at 24.81.Three weeks ago, the volatility index broke through this trend line, but building on it proved difficult.A breach likely hastens a move toward 12.
Futures positions of non-commercials are as of February 11, 2020.
Thanks for reading!


