
HeadlineCharts - Saturday January 26, 2019
The Short-Term Trend
One day last week I posted that it was time to start looking for signs of the next short-term downtrend. However, since then it looks like the short-term has gathered strength. More later...
The Longer-Term Outlook
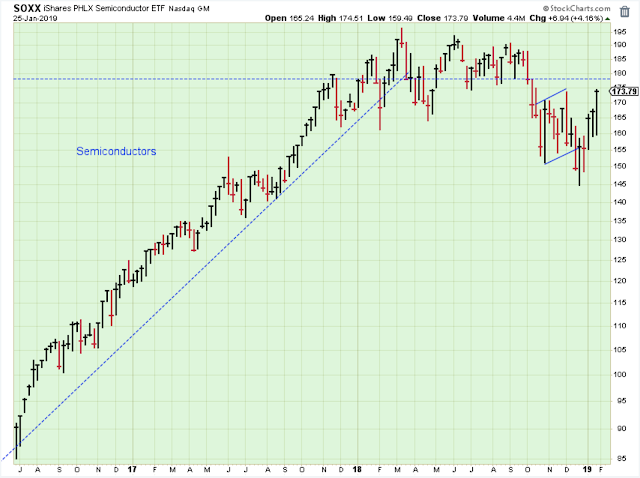
This chart is certainly showing improvement although the current price is still below important resistance. Semiconductors are market leaders, so this sign of strength reflects well on the general market.
The price pattern shown here could easily be a very large, long-term bear-market top developing, but you have to also be open to the possibility that this could also be a multi-month base that is consolidating huge gains before resuming an uptrend.
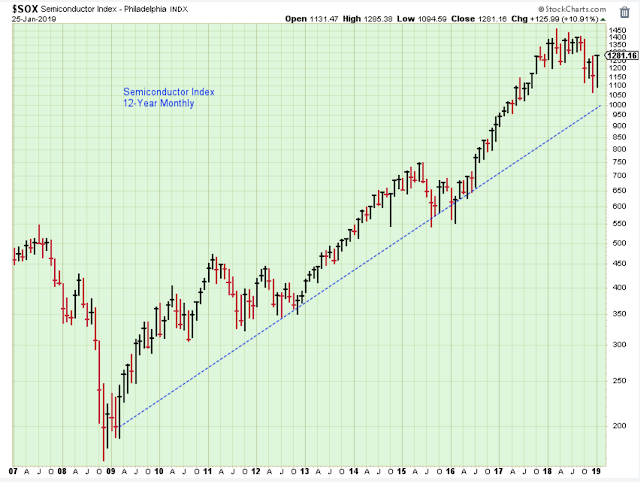
Here is an even longer-term chart of a similar Semiconductor index, and it really doesn't look bad. These stocks definitely deserved a rest within a solid multi-year uptrend.
Small Caps are important in any market. This "V" bottom bounce is a price pattern that is less convincing for the bulls, and it strikes me as requiring a lot more choppy behavior before it is ready to break higher. Still, this is a healthy retrace.
On balance, I would say that this bearish chart works against the general stock market.

The recent strength of the JNK ETF is very encouraging because it is always a good idea to invest in the same direction as junk bonds.
I'm not sure these bonds need to break to new highs in order to work in favor of stock prices, but they probably do need to hold above this upper support. A break below the 34-level for this ETF would put the general stock market back at risk for a significant decline.

I really think investors are under-estimating the importance of the price of oil. Too high and it risks higher rates. Too low and it risks the already shaky loan-quality of banks and emerging markets.
For now, it seems as though oil prices at current levels is just about right in order to maintain a balance that favors stock prices.

The Summation Indexes gave us the green light to tip toe back into stocks a few weeks ago. I say tip toe because you can see that this indicator provides lots of confusing choppiness. For now, while these indexes are above the 0-level, we focus on trying to make money with prices trending higher.
When the indexes turn lower, it's a warning to be more cautious. When they break below zero, we change the focus to defensive measures.

The all important ECRI index has ticked higher off very low levels for two weeks now.
Maybe this ECRI strength is a sign that the economic conditions can muddle along at a level that supports stock prices? And the bounce in the small caps and the money supply confirms.

Bottom line: The longer-term outlook remains negative, but there are enough signs of improvement for me to be cautiously adding to stock positions.
Outlook Summary:
The long-term outlook is negative, but improving.
The medium-term trend is up as of Jan-4.
The short-term trend is up as of Dec-26.
The medium-term trend for bond prices is up as of Nov-16 (prices higher, yields lower).
Investing Themes:
CashDividend-PayersSemiconductors<-- new
Strategy During a Bull Market:
- Buy large cap stocks and ETFs at the lows of the medium or short-term market trends.
- Buy small cap growth stocks on breaks to new highs in the early stages of market trends.
- Reduce buying when the market trend is at the top of the range.
- Take partial profits when the market uptrend starts to struggle at the highs.
- The cardinal rule is never invest based on personal politics. The stock market can do well regardless of which political party is in control.
Disclaimer: I am not a registered investment advisor. My comments above reflect my view of the market, and what I am doing with my accounts. The analysis is not a recommendation to buy, ...
more

