
Growth Leaders In Consumer Discretionary
The consumer discretionary sector is home to many of the most powerful brands in the world, and many companies in the sector have produced outstanding gains for investors over the long term. On the other hand, the sector is also widely cyclical and aggressively competitive, so picking the right names is remarkably important when investing in consumer discretionary stocks.
The following article is introducing a quantitative system based on identifying companies in the consumer discretionary sector with consistent growth leadership and rising earnings expectations. The system has produced solid backtested performance, substantially outperforming the benchmark over the backtesting period.
Past performance does not guarantee future returns, but a system such as this one makes sense from a fundamental point of view, and relying on hard quantified data for investing decisions is a far sounder approach than trying to pick winning stocks based on opinions and speculation.
Consistent Growth Leaders
The following quantitative system excludes over the counter stocks and companies with a market capitalization below 250 million from the investable universe to guarantee a minimum liquidity level and size.
The system then requires a company to generate revenue growth rates above 50% of companies in the industry over three different timeframes: the most recent quarter, on a trailing twelve months basis, and in the past five years.
The main idea behind this criteria is focusing on companies with above-average growth on a consistent basis. Even a mediocre company can generate attractive growth numbers in a particular period, but it takes a remarkably strong business to outperform the industry over multiple timeframes.
The consumer discretionary sector is savagely competitive, if a company is outgrowing the competition on a consistent basis, then it needs to have solid competitive advantages, such as a strong brand, a superior business model, or a more innovative strategy.
In addition to this, the company needs to have rising earnings expectations over the past 13 weeks. In other words, the average earnings estimate for the current year needs to be higher than it was 3 months ago.
Stock prices don’t just reflect financial performance in isolation, but performance in comparison to expectations can be a more powerful return driver. If earnings expectations for the company are increasing, this generally means that the stock price is moving in the right direction too.
This selection criteria is quite demanding, from a starting universe of nearly 6,000 stocks, only 670 companies meet the screening parameters. Narrowing down the search to only companies in the consumer discretionary sector, this leaves us with 88 stocks in the investable universe.
Among those names, the system buys the 25 stocks with the highest upward revisions in sales and earnings estimates. In a nutshell, since we have 88 companies with consistently above average growth rates and rising earnings expectations, we select from such group the stocks with the strongest increases in those expectations.
Summing up the selection criteria:
-
Non-over the counter stocks with a market capitalization level above $250 million in the consumer discretionary sector.
-
Sales growth above the industry average over the past quarter, on a trailing twelve months basis, and in the past five years.
-
Rising earnings estimates in the past 13 weeks.
- Among the companies that meet the parameters above, the system buys the 25 names with the strongest increases in earnings estimates.
The concept behind the numbers is actually quite simple and easy to understand. It all comes down to what to buy and when to buy it. This system is looking to buy companies with consistently above average growth rates in the consumer discretionary sector, and it’s also looking to buy those stocks when expectations about the company’s financial performance are on the rise.
Backtested Performance And Recommended Portfolio
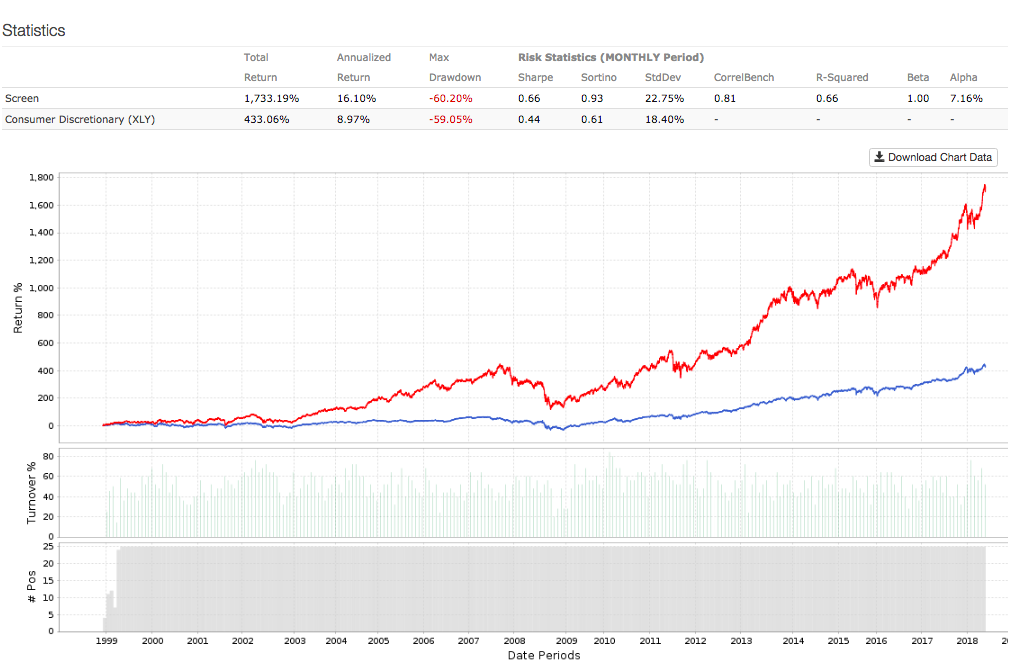
The backtest builds an equally-weighted portfolio with the 25 stocks recommended by the quantitative system, and it evaluates performance since 1999. The portfolio is rebalanced every four weeks, and it has an assumed annual expense ratio of 1% to account for trading expenses and similar considerations. The benchmark is the Consumer Discretionary Select Sector SPDR ETF (XLY)
Backtested performance numbers are quite strong, since January of 1999 following the portfolio recommendations from the system produced an average annual return of 16.1% versus 8.97% for the benchmark in the same period. System Alpha was 7.16% during the backtesting period.
Data from S&P Global via Portfolio123
Offering more information, the table below shows comparative returns for the system versus the benchmark over different time periods.
|
Return |
System |
Benchmark |
|
Annualized |
16.10% |
8.97% |
|
One Month |
9.31% |
2.14% |
|
Three Month |
16.79% |
7.51% |
|
One Year |
36.94% |
22.75% |
|
Three Year |
55.35% |
47.88% |
|
Five Year |
124.64% |
101.37% |
|
Total |
1733.19% |
433.06% |
In plain English, a $100,000 investment in the Consumer Discretionary Select Sector SPDR ETF in January of 1999 would have a current market value of nearly $533,100, and investors following the portfolio recommendations from the quantitative system would have made as much as $1.8 million based on the backtesting data.
The quantitative system is more volatile than the benchmark. This is to be expected, since the system is more concentrated and growth stocks are also more volatile than stable and predictable companies. However, the system significantly outperforms the benchmark on a risk-adjusted basis; the system has a Sharpe ratio of 0.66 versus 0.44 for the sector-tracking ETF.
The table below shows the 25 stocks currently selected by the system. The table also includes revenue growth rates for companies in the table in the most recent quarter, on a trailing twelve months basis, and over the past five years.
|
Name |
Sales% Qtr |
Sales% TTM |
Sales% 5Yr. |
|
MCBC Holdings (MCFT) |
60.4 |
32.15 |
10.73 |
|
Urban Outfitters (URBN) |
12.41 |
4.69 |
5.29 |
|
PulteGroup (PHM) |
27.16 |
17.02 |
12.21 |
|
Zagg Inc (ZAGG) |
20.57 |
24.57 |
14.46 |
|
G III Apparel Group (GII) |
15.63 |
17.56 |
14.93 |
|
lululemon athletica (LULU) |
24.87 |
17.28 |
14.09 |
|
Fox Factory Holding (FOXF) |
22.07 |
16.29 |
15.06 |
|
Cavco Industries (CVCO) |
22.49 |
12.59 |
14.01 |
|
BJ's Restaurants (BJRI) |
8.21 |
5.02 |
7.81 |
|
Green Brick Partners (GRBK) |
29.12 |
17.96 |
44.14 |
|
Century Communities (CCS) |
76 |
53.79 |
71.48 |
|
Burlington Stores (BURL) |
12.76 |
11.11 |
7.96 |
|
10.15 |
9.81 |
8.27 |
|
|
Polaris Industries (PII) |
10.76 |
16.09 |
11.08 |
|
Carrols Restaurant Group (TAST) |
13.23 |
16.58 |
15.07 |
|
O'Reilly Automotive (ORLY) |
7.21 |
5.73 |
7.75 |
|
Tractor Supply (TSCO) |
9.69 |
7.52 |
9.24 |
|
Penske Automotive Group (PAG) |
10.34 |
10.27 |
10.56 |
|
Cable One (CABO) |
28.12 |
23.55 |
3.59 |
|
Liberty Expedia Holdings (LEXEA) |
15.43 |
187.69 |
100.07 |
|
RCI Hospitality Holdings (RICK) |
19.43 |
17.62 |
9.94 |
|
Gaia Inc (GAIA) |
66.23 |
67.29 |
45.16 |
|
LKQ Corp (LKQ) |
23.28 |
16.68 |
18.75 |
|
Wingstop (WING) |
11.91 |
13.32 |
15.39 |
|
Liberty Media Corp SiriusXM (LSXMK) |
6.26 |
7.79 |
71.28 |
Backtested performance does not guarantee future returns, and only because a stock looks strong from a quantitative perspective, that doesn’t mean that it will necessarily produce market-beating returns going forward
That acknowledged, making investing decisions based on quantified data is certainly a sounder approach than relying on emotions and subjectivities when picking stocks. If the statistical evidence is any valid guide, it makes sense to expect attractive returns when investing in companies with consistently superior growth rates and rising earnings expectations.
Capitalize on the power of data and technology to take the guesswork out of your investment decisions. Statistical research has proven that stocks and ETFs showing certain quantitative attributes tend to outperform the market over the long term. A subscription to The Data Driven Investor provides you access to profitable screeners and live portfolios based on these effective and time-proven return drivers. Forget about opinions and speculation, investing decisions based on cold-hard quantitative data can provide you superior returns with lower risk. Click here to get your free trial now.
Disclaimer: I wrote this article myself, and it expresses my own opinions. I am not receiving compensation for it. I have no business relationship with any company whose stock is mentioned in ...
more

