
Grayscale Bitcoin Trust: Extreme Level Below Mean Activates Buy Signal
As we look at the weekly data points for the Variable Changing Price Momentum Indicator (VC PMI) automated algorithm in relation to the Grayscale Bitcoin Trust (GBTC), it appears that the average price as we come into this week is at $10.90. The VC PMI then calculates the extreme above and below that mean using a Fibonacci structure. It identifies two levels above and two levels below the mean.
Looking Back
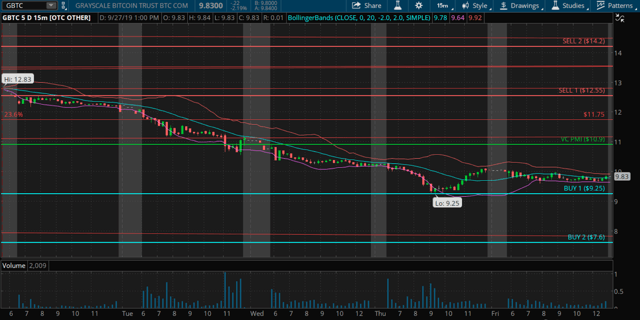
The chart shows that a high of $12.83 was made on September 23. It corresponds to a sell 1 (S1) level of $12.55 and a sell 2 (S2) level of $14.20. When the VC PMI identifies the S1 and S2 levels, it identifies the area where self-directed traders can find distribution of supply or potential sellers entering the market. The artificial intelligence tells you that there is a 90% probability at the S1 level of the market reverting back to the mean. There is a 95% probability of a reversion back to the mean if the market reaches the S2 level.
In my book, Mean Reversion Trading, I describe S1 and S2 as very high probability areas for trades. If you are long, these levels are excellent areas to sell or take profits in managing inventory. If you go short from these levels, they represent high probability trades. The algorithm uses the 15-minute bar and the artificial intelligence directs you to a methodology. If the price touches the S1 level the first time, it tells you to prepare. We have reached a pivot point. If you are long, go neutral. If you are neutral and looking to go short, get ready for a confirmation. Then if the price closes below the S1 level, enter the market. In this case, the market made a high of $12.83 on the 23rd, it closed below the S1 of $12.55 on the same day, closing at $12.30. This activated a short signal and activated a protective level, with a stop at the level above: $12.55 in this case. It also identifies the target as the level below, which in this case was the mean of $10.90. The structure identifies the trigger point, a stop and a target. The target was completed on the 24th by the price coming down to the mean from $10.90.
"That was a pretty decent profit on a swing trading position overnight," Equity Management Academy CEO Patrick MontesDeOc said.
Once the target is completed, the VC PMI advises you to go neutral. It does not recommend to trade when the price trades around the mean.
"It suggests that you execute only the highest probability trades," MontesDeOca said, "as identified by the VC PMI at the S1 or S2, B1 or B2 levels."
In this case, the market did not reach the S2 level of $14.20 because there was not enough demand to penetrate any further to the upside. The market came down to close below $12.55, activating a short trigger.
As the market continues to come down on the futures contract, we do not suggest trading the mean. It is a 50/50 standard deviation on whether it will go up or down.
On the 26th, the market did come down to a buy level, which is a time to enter the market and go long.
The low was $9.25 on the 26th. The Buy 1 (B1) level is $9.25. As you can see, the price activated a buy signal: a long trigger.
The VC PMI identifies levels of supply and demand. As the market comes down, the VC PMI identifies the trigger points. When a buy signal is activated, in this case at $9.26, it identifies your stop at $9.25. It also automatically identifies your target as the mean at $10.90.
"The market has gone from the extreme above the mean to the extreme below the mean," MontesDeOca said.
There is now a 90% probability of the price reverting back up to the mean of $10.90.
Next Week
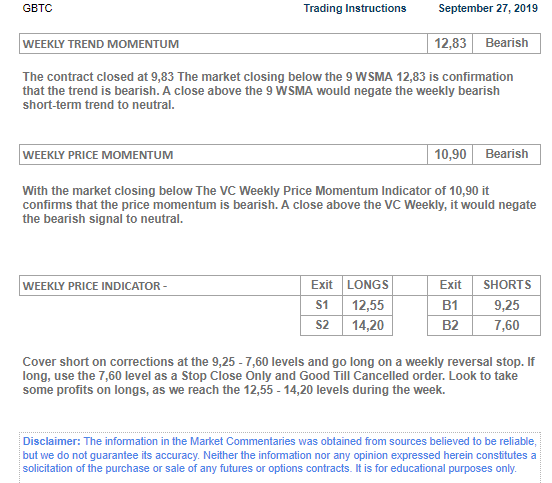
As we come into next week, we are coming in with a bullish signal activated at $9.25. Your stop is $9.25. Your initial target is $10.90. The market has also activated a B2 level of $7.60 with a 95% probability that if the price is activated down here, the price will revert back to the mean of $10.90.
It appears that $9.25 is offering a very strong level of support and we suggest that you maintain all long positions activated at $9.25, using $9.25 as your protective level on a close below using the 15-minute bar.
The VC PMI Automated Algorithm
We use the proprietary Variable Changing Price Momentum Indicator (VC PMI) to analyze the precious metals markets and several indices. The primary driver of the VC PMI is the principle of reversion to the mean ("Mean Reversion Models of Financial Markets," "The Power of Mean Reversion in Factor- Based Investing"), which is combined with a range of analytical tools, including fundamental logic, wave counts, Fibonacci ratios, Gann principles, supply and demand levels, pivot points, moving averages and momentum indicators. The science of Vedic mathematics is used to combine these elements into a comprehensive, accurate and highly predictive trading system.
Mean reversion trading seeks to capitalize on extreme changes in the price of a particular security or commodity, based on the assumption that it will revert to its previous state. This theory can be applied to both buying and selling as it allows a trader to profit on unexpected upswings and buy low when an abnormal low occurs. By identifying the average price (the mean) or price equilibrium based on yesterday's supply and demand factors, we can extrapolate the extreme above this average price and the extreme below it. When prices trade at these extreme levels, it's between 90% (Sell 1 or Buy 1 level) and 95% (Sell 2 or Buy 2 level) probable that prices will revert to the mean by the end of the trading session. I use this system to analyze the gold and silver markets.
Strengths And Weaknesses
The main strength of the VC PMI is the ability to identify a specific structure which price level traders can execute with a high degree of accuracy. The program is flexible enough to adjust to market volatility and alerts you when such changes take place, so one can adjust strategies accordingly. Such changes include when the market breaks out of a consolidation phase or a trend accelerates. Such volatility usually happens when the market has produced a signal at the S2 or B2 level and the market closes above or below these extreme levels.
The day trading program then confirms that a higher fractal in price has been identified and the market will move significantly higher, although the same principle applies if the market falls significantly. The price closing above the S2 level indicates that the buying demand is greater than the supply. This means that the market has found support for the next price fractal. Conversely, the price closing below the B2 level indicates that the selling pressure has met demand greater than supply at the extreme below the mean, and prices should revert back to the mean.
The basic concept of the VC PMI is that the program trades the extremes of supply and demand based on the average price daily, weekly and monthly.
The strongest relationship we find in the algorithm is when the daily price is harmonically in alignment with the weekly and monthly indicators. We call this "harmonic timing." Such an indication produces the highest probability (90%) that the price will revert from these levels to its daily, weekly or monthly average.
Disclosure: Long BTSC
To learn more about how the VC PMI works and receive weekly reports on the E-mini, gold and silver, check us out on more


