
Gold Price Forecast: 2018-High On Radar Amid Overbought RSI Signal
Gold rallies to fresh yearly highs despite hopes of a U.S.-China Trade Deal, and recent price action brings the 2018-high ($1366) on the radar as the bullish momentum appears to be gathering pace.
GOLD PRICE FORECAST: 2018-HIGH ON RADAR AMID OVERBOUGHT RSI SIGNAL

The narrowing threat of a global trade war has done little to curb the price of bullion as the Federal Reserve abadons the hawkish forward-guidance, and gold may continue to catch a bid as a growing number of Fed officials endorse a wait-and-see approach for monetary policy.
In a recent interview with Reuters, New York Fed President John Williams, a permanent voting-member on the Federal Open Market Committee (FOMC), argued that there needs to ‘be a different outlook either for
growth or inflation’ for the central bank to implement higher interest rates, and went onto say that ‘monetary policy is where it should be’ amid the mixed data prints coming out of the U.S. economy.
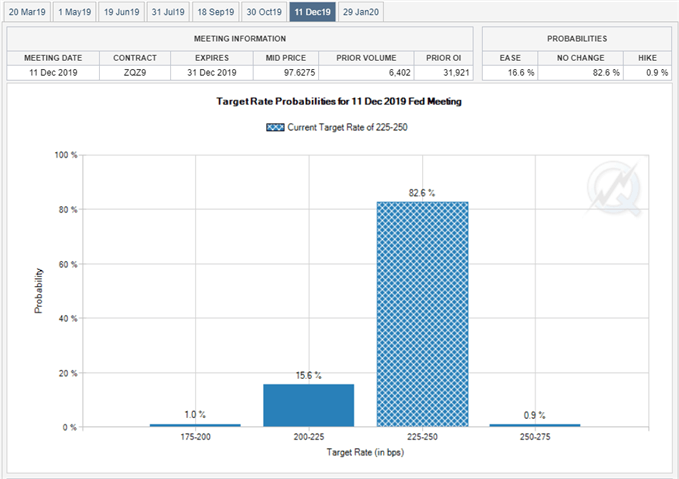
The comments suggest the FOMC will stick to the sidelines for the foreseeable future as the central bank remains ‘data dependent,’ and Fed Fund Futures may continue to show Chairman Jerome Powell & Co. on hold throughout 2019 as ‘the case for raising rates has weakened somewhat.’ At the same time, it seems as though the Fed is on track to taper the $50B/month in quantitative tightening (QT) as Governor Lael Brainard indicates that the ‘balance-sheet normalization process probably should come to an end later this year,’ and the FOMC Minutes may continue to heighten the appeal of gold should the policy statement highlight a greater willingness to adopt a more accommodative stance.
With that said, a further adjustment in the Fed’s forward-guidance may fuel a larger advance over the coming days, with the 2018-high ($1366) on the radar as a bull-flag formation pans out. Moreover, recent developments in the Relative Strength Index (RSI) suggest the bullish momentum is gathering pace the oscillator extends the upward trend from late-2018 and pushes into overbought territory.
GOLD DAILY CHART
(Click on image to enlarge)
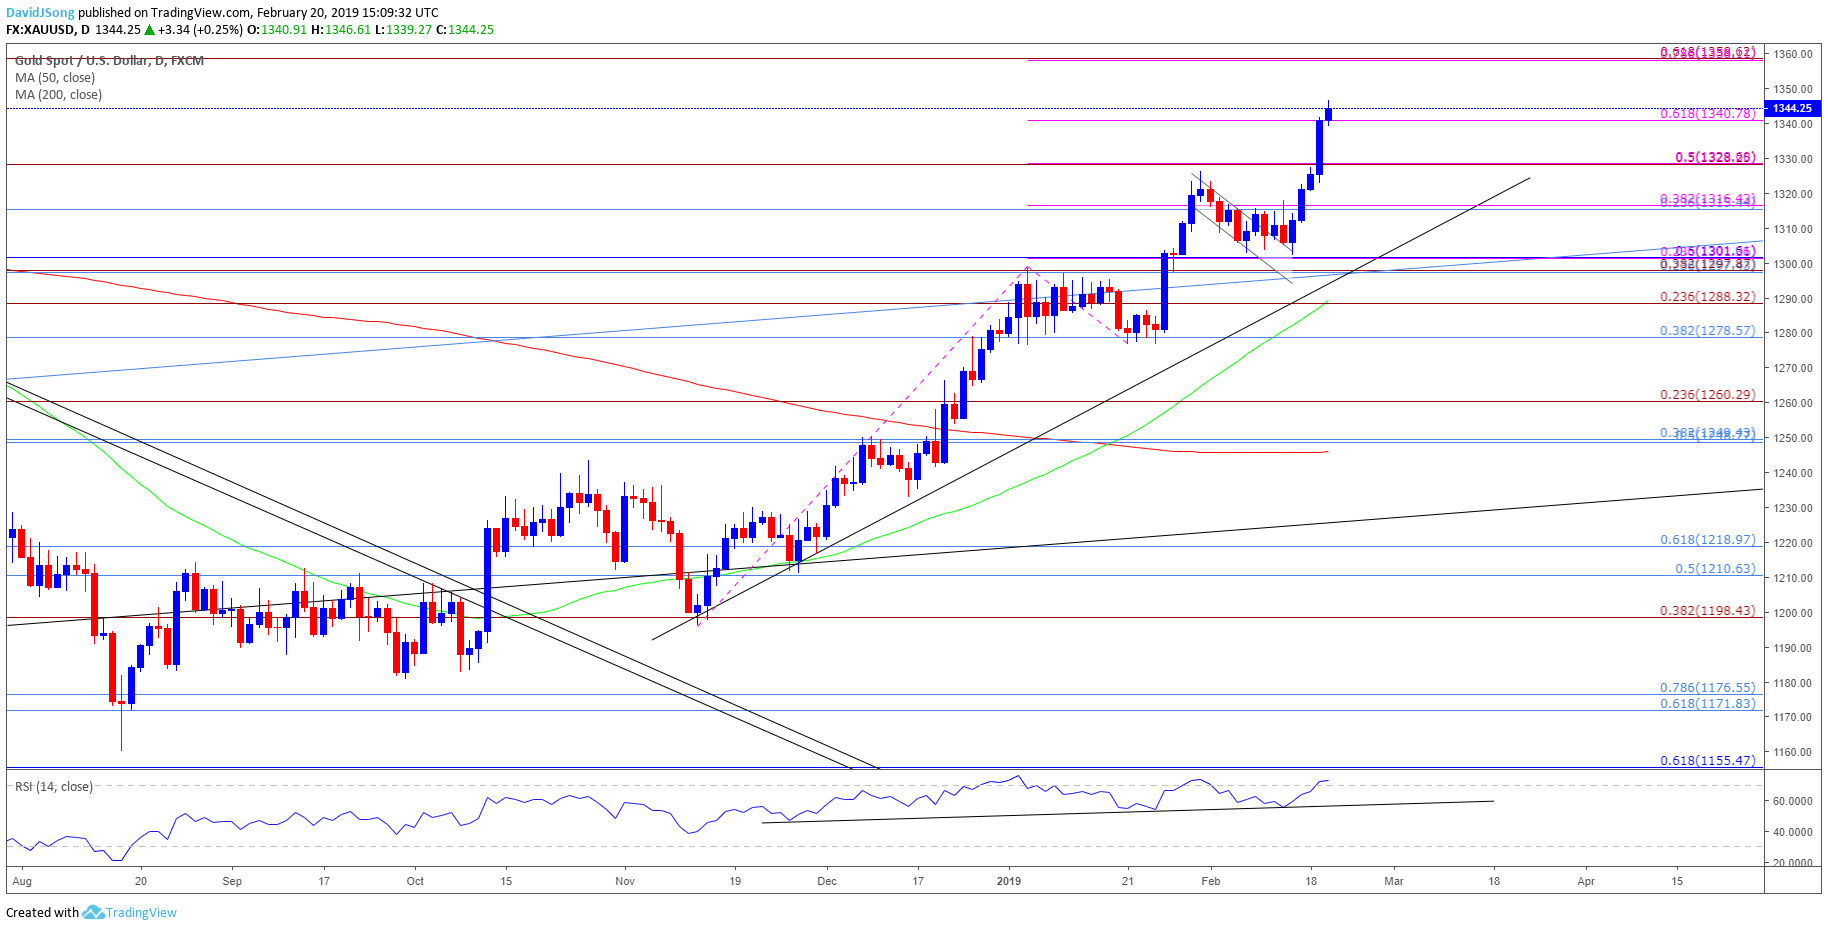
- The broader outlook for gold remains constructive as both price and the Relative Strength Index (RSI) track the bullish trends from late-2018, while the former-resistance zone around $1298 (23.6% retracement) to $1302 (50% retracement) offers support.
- The break/close above $1340 (61.8% expansion) raises the risk for a run at the 2018-high ($1366), but gold has staged a string of failed attempts to close above the Fibonacci overlap around $1358 (23.6% expansion) to $1359 (61.8% expansion) back in 2018, with bullion at risk for a pullback should gold prices exhibit a similar reaction around the key resistance zone


