
Gold Miners Show First Bullish Evidence
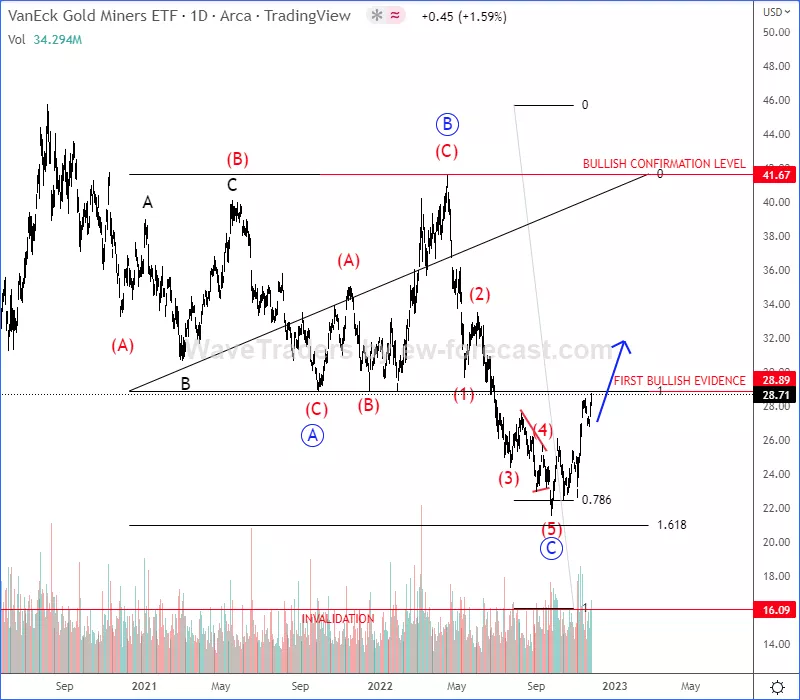
Gold is trading bearish for the last 2 years, but from Elliott wave perspective we see gold miners chart finishing an A-B-C flat correction that can be easily supportive for gold.
Technically speaking, gold miners chart is bouncing away from important support at 78,6% Fibo. retracement and 161,8% Fibo. extension. Now that is just about to break first bullish evidence level, seems like bulls are kicking back, so we should be aware of more gains on gold, just be aware of short-term pullbacks.
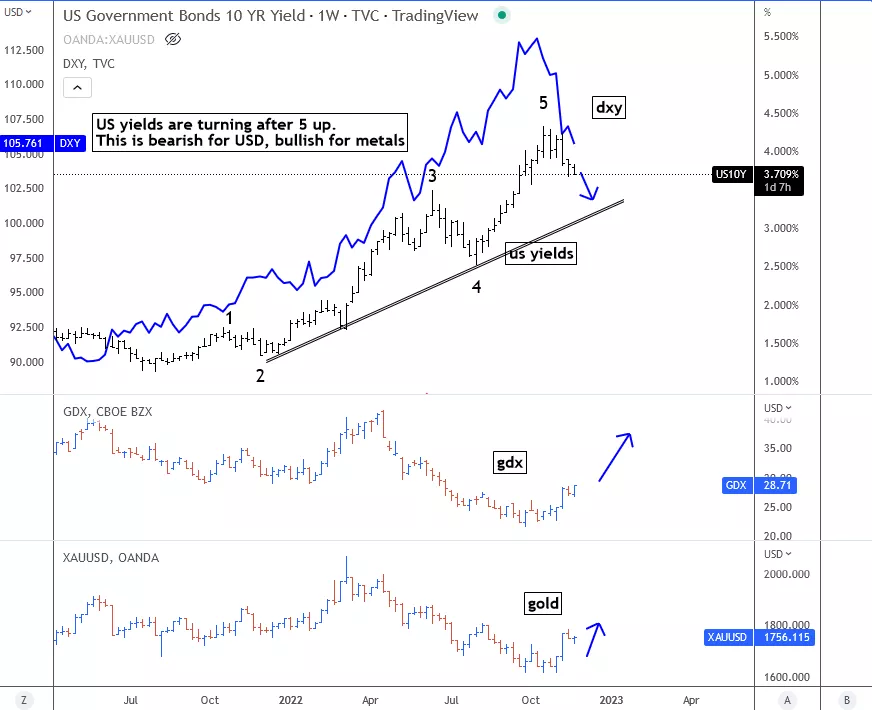
The main reason for the gold market rally is a reversal down on US Yields and US Dollar-DXY after a completed 5th wave. So, both of them can easily see more downside pressure due to a negative correlation, especially if we consider that gold is back to bullish mode.
More By This Author:
DAX Is Trading In A Five-Wave Bullish Impulse
Oil: The Price For The Fourth Quarter Of 2022 At $100
UK100: The Real Estate Market, A Harbinger Of Recession In Great Britain
Disclosure: Please be informed that information we provide is NOT a trading recommendation or investment advice. All of our work is for educational purposes only. Visit www.wavetraders.com for more ...
more

