
Gold: Can't Keep A Strong Bull Trend Down
Gold Looking Forward
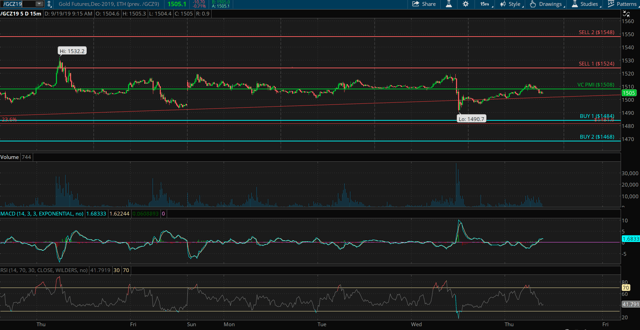
If we look at the weekly indicators, the market after the Fed rate-cut announcement collapsed to make a low of $1490.70. The price came right into a major daily buy signal and did not quite come down to the weekly B1 level of $1484. It found very strong support or demand at $1490 level, reverting the level right back up to the weekly average price of $1508 for the rest of the week.
With the price coming back above the average price of $1508, it activated a S1 target of $1524 to a S2 of $1548. Traders who go long, use $1508 as your protective level on a close below using the 15-minute bar. A second close below $1508 will activate the B1 of $1484 to B2 of $1468.
For most of our traders, we do not recommend trading futures or options when the market is trading around the average price. We recommend to our traders in our Elite Trading Room to look at securities or ETFs, which is what we trade ourselves.
Gold Overview
The gold market is beginning to realize that the real currency that has been out there for thousands of years are the precious metals, gold and silver. In a world of negative interest rates and the Fed with no bullets left, precious metals are crucial.
I have said raising interest rates make no sense in a world of such ballooning debt. The only reason they raised interest rates was that they believed there would be a crisis, so they need to raise rates to be able to lower them later when a crisis hit.
In a world of negative interest rates, you have few choices of where to put your money, at least in terms of currency. That is why the US dollar has been doing well, since it is the only one showing a positive yield, although it is moving toward zero or negative interest rates. If it becomes the case, this policy will have a massive effect on retirees who live on interest. He said it will create a great deal of fear in the market, which will lead to people holding back, and where to make additional income. On top of that, crude oil prices will be affected by any geopolitical crises in the Middle East. Over the past five years, it is clear that gold and silver have been the most undervalued assets in the world. The powers that be have been manipulating the price of gold and silver against the dollar. If we let gold go up to $5,000, as some anticipate, it would cripple the dollar and create a global economic crisis. If you price gold to currencies, to interest rates, to stocks, then gold is tremendously undervalued.
Gold: Recent Movements
When gold broke $1375 it established a higher fractal in price, with gold now trading at $1515.
In our last report, gold had activated a buy signal at $1494. You can see on September 13 that the market activated a buy signal from Buy 2 (B2). Looking at the daily and weekly numbers, I want to show you how we use this indicator to identify the highest probability trades using the Variable Changing Price Momentum Indicator (VC PMI).
Once we identify the average price, in green, we can then extrapolate the extremes above and below the mean, with two levels above and two levels below. The Sell 1 (S1) and Buy 1 (B1) levels have a 90% probability of the market reverting from there to the mean, while the Sell 2 (S2) and B2 levels have a 95% probability of a reversion to the mean.
On Friday the signal at B2 was activated. Automatically the target above, $1505, became your target. That target was then completed at $1508/$1510. On the 15th of September, the target was completed.
This is what MontesDeOca calls a perfect reversion from the extreme level below the mean. He teaches traders at the Equity Management Academy and on Ticker Tocker how to trade using the VC PMI using the algorithm's methodology.
As we came in on the 13th, the market activated a buy signal and automatically the mean target was activated, as well as the level above. Both targets were completed, with the market reaching the S1 level of $1519 by the 15th. The VC PMI automated algorithm is a GPS for your trading. It tells you, when you are ready to trade, it identifies a trade direction or destination. You wait to see a trigger point to enter the market, either up or down. The VC PMI can be used for day, swing or position trading.
Once the target is completed, you go back to neutral and wait for the close using the 15-minute bar to activate the next set of signals. If the price closes below the S1 level of $1519, it activates a short signal. On the 15th, the market closed at $1515 and activated a short signal. MontesDeOca wanted to stress that the artificial intelligence of the algorithm in addition to identifying a perfect five-level Fibonacci sequence, also identifies in color areas of distribution of supply or resistance. It is where we can expect sellers to come into the market.
The first 15-minute bar identifies the setup and if you are long, take profits and go neutral. The move from that B2 signal last Friday at $1494 was completed at the S1 level of $1519. On the next bar, the market did not close above $1519, which, if it had, meant that the market would have activated the S2 target of $1524. The S1 level is the 1:1 relative implied volatility probability factor with a 90% probability of a reversion from there to the mean below. The chart shows that the target of $1519 was met.
The signal gave you a buy trigger from $1494, told you to take profits at $1519, activated a short trigger at $1515 on the 15th of September at 5:30 am, and activated a target of the mean below at $1519 by 10:30 pm. It produced a signal from the extreme level below the mean of B2 to the extreme level above the mean of S1, which gave you a $22 gain on the long side, and s short at $1515 completed at $1510, which is another $9 profit. Those two trades alone were about $3,000 profit per futures contract.
As we continue with this daily chart, the artificial intelligence tells you that when the price trades around the average price, go neutral and do not trade in the futures contracts. Wait for the highest probability trades, which is when the price comes down once again to the blue level of B1. In this case, B1 is $1505. Now we are at $1496. When the price comes down and touches the trigger the first time, it's an alert: get ready. If the price closes above $1505 using the 15-minute bar, it's a buy trigger. In this case, it activated a buy signal at $1505.30. Your stop was $1505 on the close only. We do not use straight stops. Conservative traders can use a close below this level as a stop. The target is the mean of $1510. Once again, the market went below the mean of B1 and did not come down to B2 of $1496. It experienced demand. There is a 90% probability that we will identify buyers at that level. If it closes above, it confirms that we found more buyers than sellers, as the price reverts. You go long at $1505.30. Your stop is a close below $1505 on the 15-minute bar. The market went up and reached the target of $1510.
Recent Interview
In a recent interview, I spoke with Steve Kalayjian, Chief Market Strategist and Co-Founder of Ticker Tocker.
On the Federal Reserve cutting interest rates, I said the Fed is in a dilemma because of the recent spike in crude oil. The market appears to have already factored in a 25 point cut. It is uncertain what is going to happen with Iran, that only adds another uncertainty to the markets. The Fed might lower 50 points, or cut 25 basis points now and 25 in the next session. The pressure is on the Fed to lower interest rates a lot more than half a point.
Kalayjian said it is all very political. The confidence level is up, unemployment is down, so he did not see a significant cut coming. Any cut, he said, is already embedded anyway.
MontesDeOca mentioned the amount of debt that has to be taken into consideration. The debt is beginning to build some pressure in the market in relation to how much debt is building globally. Metals are beginning to anticipate something. The 1500 level seems to be a solid floor and we are making higher highs. You have to pay attention to the metals. Currencies and rates are in the negative. How long can this system hold this ridiculous scenario that doesn't make any sense?
The VC PMI Automated Algorithm
We use the proprietary Variable Changing Price Momentum Indicator (VC PMI) to analyze the precious metals markets and several indices. The primary driver of the VC PMI is the principle of reversion to the mean ("Mean Reversion Models of Financial Markets," "The Power of Mean Reversion in Factor- Based Investing"), which is combined with a range of analytical tools, including fundamental logic, wave counts, Fibonacci ratios, Gann principles, supply and demand levels, pivot points, moving averages and momentum indicators. The science of Vedic mathematics is used to combine these elements into a comprehensive, accurate and highly predictive trading system.
Mean reversion trading seeks to capitalize on extreme changes in the price of a particular security or commodity, based on the assumption that it will revert to its previous state. This theory can be applied to both buying and selling, as it allows a trader to profit on unexpected upswings and buy low when an abnormal low occurs. By identifying the average price (the mean) or price equilibrium based on yesterday's supply and demand factors, we can extrapolate the extreme above this average price and the extreme below it. When prices trade at these extreme levels, it's between 90% (Sell 1 or Buy 1 level) and 95% (Sell 2 or Buy 2 level) probable that prices will revert to the mean by the end of the trading session. I use this system to analyze the gold and silver markets.
Strengths And Weaknesses
The main strength of the VC PMI is the ability to identify a specific structure which price level traders can execute with a high degree of accuracy. The program is flexible enough to adjust to market volatility and alerts you when such changes take place, so one can adjust strategies accordingly. Such changes include when the market breaks out of a consolidation phase or a trend accelerates. Such volatility usually happens when the market has produced a signal at the S2 or B2 level and the market closes above or below these extreme levels.
The day trading program then confirms that a higher fractal in price has been identified and the market will move significantly higher, although the same principle applies if the market falls significantly. The price closing above the S2 level indicates that the buying demand is greater than the supply. This means that the market has found support for the next price fractal. Conversely, the price closing below the B2 level indicates that the selling pressure has met demand greater than supply at the extreme below the mean, and prices should revert back to the mean.
The basic concept of the VC PMI is that the program trades the extremes of supply and demand based on the average price daily, weekly and monthly.
The strongest relationship we find in the algorithm is when the daily price is harmonically in alignment with the weekly and monthly indicators. We call this "harmonic timing." Such an indication produces the highest probability (90%) that the price will revert from these levels to its daily, weekly or monthly average.
Disclosure: I am long NUGT.
To learn more about how the VC PMI works and receive weekly reports on the E-mini, gold and silver, check us out on more


