
Gold And Gold Stocks Approach Resistance
Precious Metals have enjoyed their best rally since the spring but are approaching significant resistance levels.
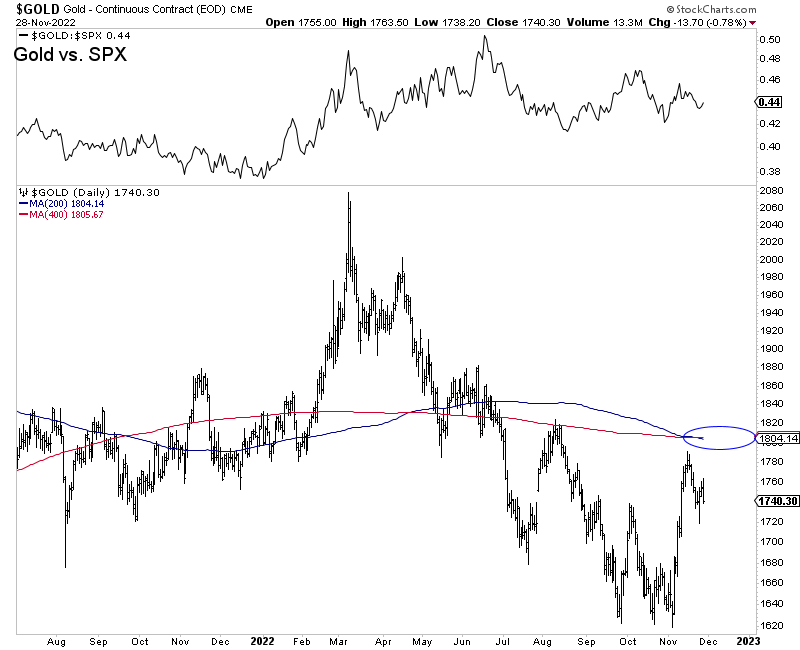
After trading as high as $1791, Gold has fallen back to $1740.
The weekly and monthly charts show stiff resistance in the $1780 to $1820 zone.
The daily chart below shows a confluence of resistance (long-term moving averages) at $1805.
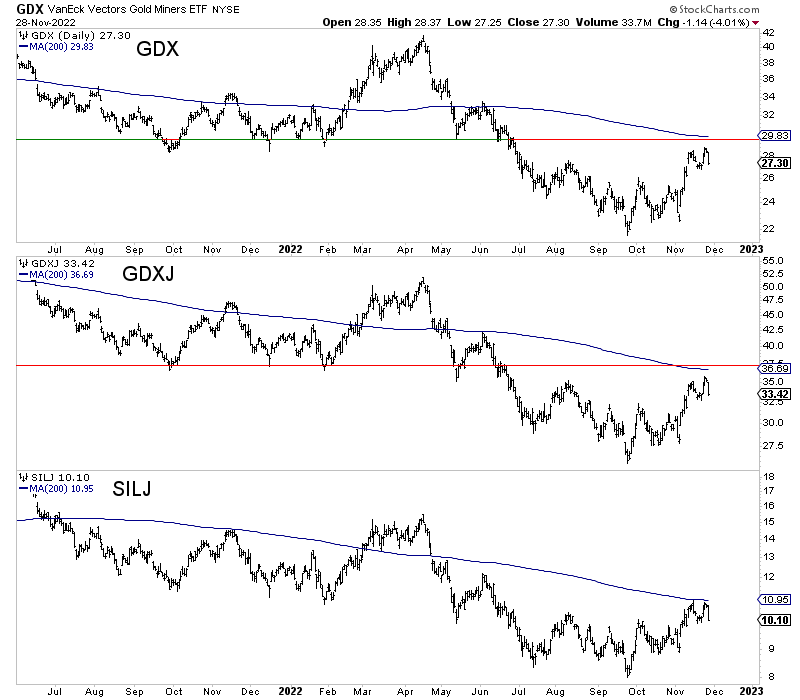
Gold and silver stocks, which have outperformed the metals recently, rallied up to close to a confluence of resistance.
GDX has significant resistance at $29-$30, and GDXJ has considerable resistance around $37.
Meanwhile, SILJ, which trades more volume than SIL, has tested its 200-day moving average twice.
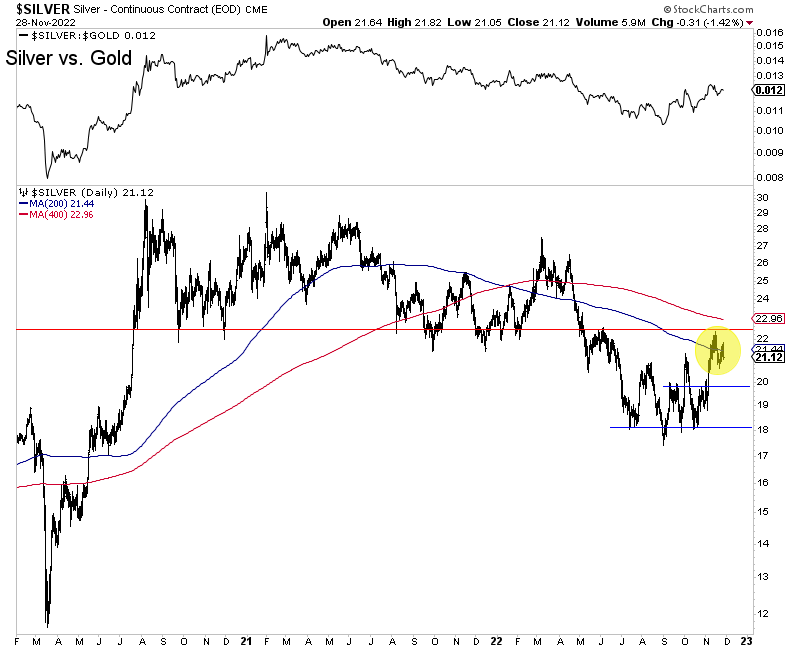
Silver bottomed before Gold and the gold stocks and has led the rebound.
It has pulled back after reaching $22, a major resistance level. Look for support near $20 to hold if tested.
Silver should continue to consolidate, but if it can make a weekly or monthly close above $22, it could signal more upside for the sector and a new leg higher.
Fundamentally, the next catalyst figures to be an official end to Fed rate hikes. This may or may not be preceded by the next round of selling in the broader market.
That selling could hit precious metals a bit but would set the stage for a big and sustained leg higher.
This remains one of the best and most ideal times to be a speculator in this sector. High-quality juniors are trading near their lows; the sector is hated yet has outstanding upside potential in 2023 and beyond.
More By This Author:
Subtle Bullish Catalysts For GoldMajor Market Decline To Impact Gold?
Gold & Silver Monthly Charts Argue Bottom
Disclaimer: TheDailyGold.com and TheDailyGold Premium are not investment advice. The website, email newsletter and premium ...
more

