
Gold – The Hedge Against Government Failure
In The Case for Gold published in mid October 2015 we wrote that:
-
Gold will not fall below US $1,100/oz
-
Gold will benefit from the imminent weakening of US equities
-
Gold will benefit from imminent currency market volatility
-
US dollar does not need to fall for gold to rise
-
Long-term view on gold remains bullish because of unresolved economic, financial and political issues facing the world, which will continue to drive long term investors towards gold
-
Gold equities typically offer exposure to gold at a greater discount often making them very attractive for investors.
In mid October gold was trading at $1,150/oz dipping as low as $1,050 end of November through to the end of December. The metal rose as high as $1,246 since the beginning of 2016, and is currently trading at around $1,225, which represents a 6.5% gain since mid October, and a 16.7% gain since the year-end lows.
In the broader context, our forecasts were rooted in the view that the Quantitative Easing experiment was failing and that was soon to become painfully apparent.
Unraveling Keynesian Failure
The Keynesian model dictated that in order to avoid inefficient macroeconomic outcomes, particularly in times of recession the public sector (Government) should interfere with policies - the Central Bank with monetary policy and the Government by fiscal policies.
Keynes probably never would have imagined the scale to which his theories would be extended after the unraveling of private debt during 2007-2008.. 637 rate cuts and $12.3 trillion in global quantitative easing later, monetary growth did not bring about the awaited real growth in the US economy. We are seeing severe asset deflation globally (declining real prices), central banks around the world are increasingly entering or going deeper into the negative interest rates space in a desperate attempt to re-inflate the markets.
The end of 2015 to many resembled the early stages of the financial crisis of 2007-2008 and the markets are becoming increasingly volatile. The 16% rise in the bullion price this year is a reflection of that.
Cipher’s October Forecast verses Market Performance
-
Gold will not fall below US $1,100/oz: Our expectation was supported by strong fundamentals indicating $950-$1000 to be the price at which supply and demand will balance with no investor purchases.
-
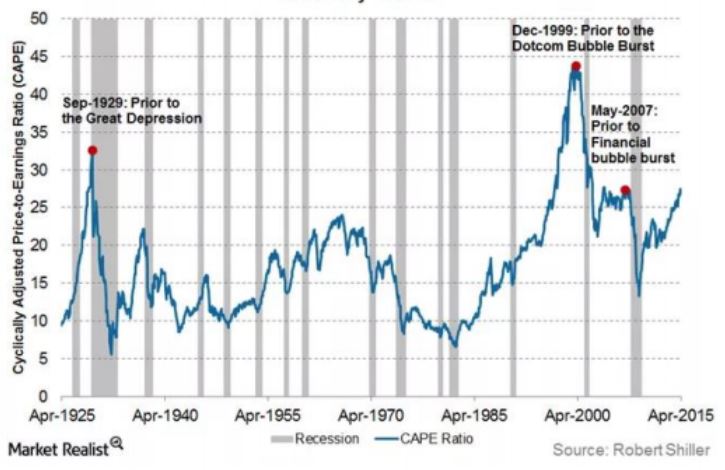
Gold will benefit from the imminent weakening of US equities: Our expectation of imminent weakening of US equities was based on the following argument: We had determined that expectations for possible increase in interest rate were already built into the gold price; on the other hand we believed that those expectations were not yet built into US equities. The Price-to-Earnings Ratios were nearing the levels they had reached in May 2007 before the last major correction. Only two other times in history had P/E ratios had been higher:
Global market activity in the months prior to October 2015 was pointing to the build up of negative sentiments toward US equities. The U.S stock market fell roughly 6% in the previous three months (big sell off in August 2015) lowering the total return for the S&P 500 Index over the previous year to less than 1%. The drop in the demand for US stocks in August 2015 had been heralded by the fall of the NYSE margin debt (over 6% in July and August) below a seven-month moving average.
Margin debt, compiled monthly by the NYSE, reflects the credit extended by brokerages to clients to buy stock. It correlates closely to indexes such as the S&P 500 because equity is used to back the loans. As share prices rise more margin is extended and more shares can be bought.The contracting of margin debt is a sign of a decline in investors’ confidence in US equities. We illustrated this with the following chart:
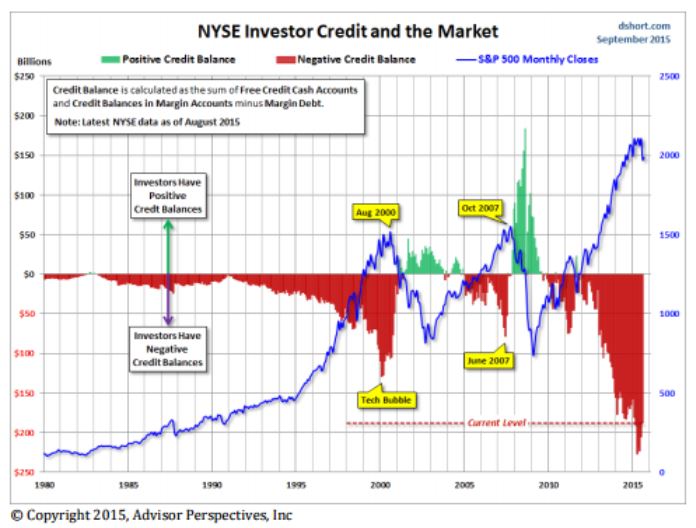
Our prediction was that October decline in margin debt is a leading indicator for a sell-off in US equities. We also warned that a potential interest rate increase would add additional pressure on equity prices, as it would make any borrowing to cover margin accounts more expensive, resulting in the need to liquidate more shares to cover the margin debts.
Our expectations were sound: The Dow Jones Industrial Average was trading at 17,200 in mid-Oct, rose to 17,977 in November was 17,700 in late Dec. Since then fell to a low of 15,450 in Feb and is currently 16,390. Representing a 4.7% loss since mid-Oct and a 10% fall to its low.
The S&P 500 was trading at 2,033 in mid-Oct; rose to 2,109 in November was 2078 in late Dec. Since then fell to a low of 1829 in Feb and is currently 1917. Representing a 5.7% loss since mid-Oct and a 10% fall to its lows
We believe that the wider equity markets will continue to suffer due to expectations for the US and Global Economies to further deteriorate.
The concerns during the last quarter of 2015 that QE was ineffective were relatively innocuous compared to the negative sentiments reverberating through the markets now.
Investors are now concerned that the QE policies have created new bubbles instead of real economic growth and now that the Fed is no longer buying bonds and moved to raise rates, the artificial growth in asset prices that we’ve seen since the last financial crisis will come undone. A case in point is the slump in commodities after the build up of a massive bank exposure since 2008 via debt financing.
On February 18th, Bloomberg wrote that since central bank easy-money policies took off (2008). The 5,000 biggest publicly traded companies tracked by Bloomberg in the iron and steel, metals and mining, and energy sectors have doubled their debt to a staggering combined $3.6 trillion combined. Much of the increase is due to money that was borrowed to dig mines and wells whose output, at previous prices, would have easily repaid most maturing bonds and loans. The falling commodity prices however are now making it impossible for many companies to meet their obligations.
The credit trouble on the horizon is reminiscent of the subprime mortgages and could potentially lead to a bigger disaster. Bloomberg estimates that the amassed 3.6 trillion in liabilities by this sector represents about 1.5 percent of the total assets of all the worlds publicly traded banks. To put things into context, the U.S. subprime mortgages represented less than 1 percent of listed banks' assets at the end of 2007. Five years ago, the commodity companies had negative leverage ratios and today they are 8 times geared. Additionally this debt has been securitized and repackaged similarly to the mortgaged backed securities spreading the exposure and increasing the global risk.
In order to avoid defaulting on their debts and causing an even bigger collapse in the financial markets corporate profit margins have to rise; this will happen if there is fundamental rebalancing in the market:
-
lower costs = many producers squeezed out (shut downs and layoffs) = lower output
-
higher commodity prices = higher demand and/or lower supply; higher demand will only occur with
growth in consumption from increased economic growth
3. Gold will benefit from imminent currency market volatility:
We predicted currency market volatility to be a primary driver of gold investment demand. Our expectations were based on the divide between the US Fed Reserve monetary policies and those of the developed world’s other two big central banks—the Bank of Japan and the European Central Bank. While the Fed has stopped its quantitative easing (QE) program and may look to tighten monetary policy this year the Bank of Japan is still pursuing QE and the ECB has just agreed to start buying bonds. This discrepancy has been driving the dollar higher against both the yen and the euro.
The Fed’s policies are not the only reason behind the strong dollar. In addition falling commodity prices are pushing exporting countries into beggar-thy-neighbor type of policies aiming at competitive currency devaluations and have created big swings in exchange rates. Problems are additionally exacerbated by the fact that many currencies are pegged to the major ones and inherit their volatility.
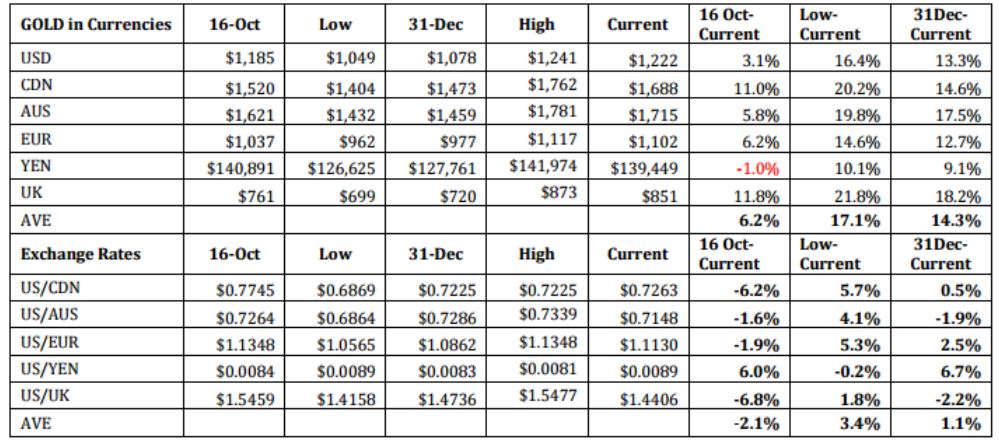
In January the Swiss franc jumped by 30% in a matter of minutes. Over the past year, the Russian ruble has fallen by 40% against the dollar, while the Canadian and Australian dollars have recently dropped to six-year lows against the greenback.
The following table shows gold priced in various currencies and their respective exchange rates to the US dollar.
4. US dollar does not need to fall for gold to rise:
In October we said that opposite to popular belief, it is not at all uncommon for gold and the dollar to rise at the same time. This was the case in 1979 and at times during the recent financial crisis in 2008, for example, and has been the case in parts of 2014 and 2015. Gold and the dollar are seen as the two ultimate safe haven investments. Heightened uncertainty in the world drives investors to turn to gold and the dollar simultaneously.
As the above tables show, gold has risen in all currencies except the Yen.
Gold Equities
Many investors buy gold mining equities as a substitute for gold. Investors have traditionally been wary of investing in commodities, but are more comfortable with equities. Gold equities have a stronger correlation to gold than they do to the broader equity markets (such as S&P 500). Simply put shares of gold companies act more like gold than anything else. Moreover gold equities outperform gold during rising gold prices, and underperform if gold falls.
In the current market environment we expect generalist investors to come back to the market starting with the quality producers, and work their way down the food chain. Institutional money is already flowing into the major gold miners – we have all seen big moves off of December lows. The S&P TSX Gold Index consists of 39 precious metal mining companies traded on the Toronto Stock Exchange (TSX). The S&P/TSX Gold index was trading at 145 in mid-October, fell to 118 in November was 132 in late December, since then rose to a high of 183 in February and is currently 178. Representing a 22.7% gain since mid-Oct and a 34.8% gain from its lows.
Caution is needed – focus on companies with operational health that are built to withstand volatility in price:
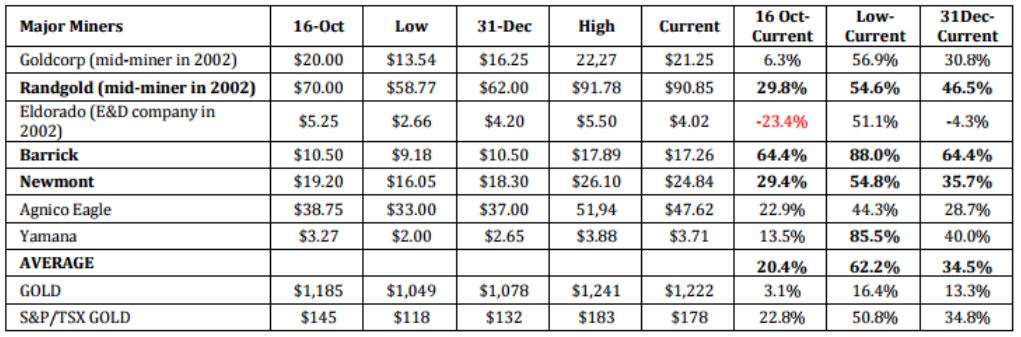
Cipher’s 2 top picked major mining companies Randgold, Newmont Follow the Cash: Review of 7 Major Gold Miners December 30, 2015 along with Barrrick Gold have out performed gold and the S&P/TSX gold index.
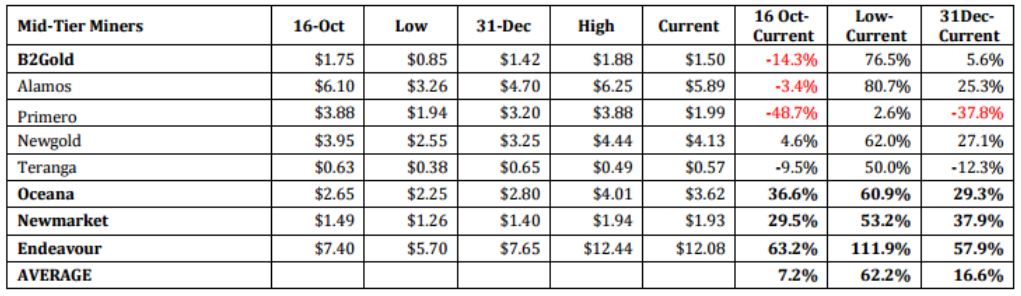
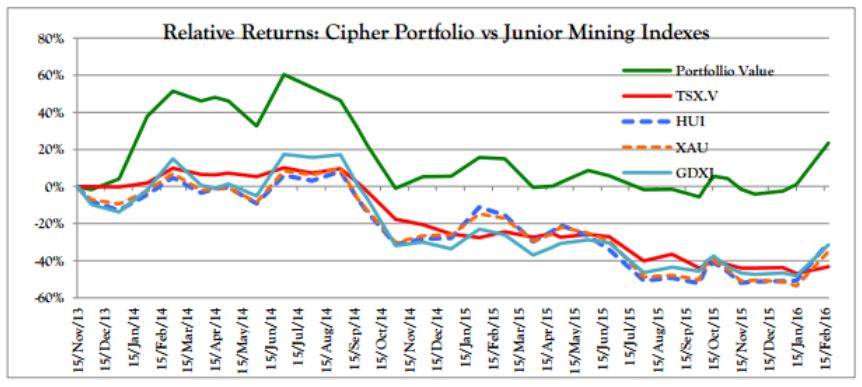
On average Ciphers portfolio of quality Exploration & Development companies has outperformed both mid- tiers and even the majors, and continues to out perform the main junior resource indexes by a substantial margin.
Disclaimer Cipher Research Ltd. is not a licensed broker, broker dealer, market maker, investment banker, investment advisor, analyst, or underwriter and is not affiliated with any. There is no ...
more

