
While Inflation Rises Strongly Spain, Macroeconomic Data From China And Japan Continue To Demonstrate A Slowdown
Both during yesterday's and today's sessions, the macroeconomic calendar has been full of important news that continue to confirm the problems we have been noticing during the last few weeks. Namely, the increase in inflation and the economic slowdown caused by, amongst other things, the energy crisis and the consequences of the pandemic.
As we mentioned in yesterday's analysis, the market was awaiting an outcome of the negotiations in the United States between Democrats and Republicans regarding raising the debt ceiling in order to avoid defaulting on their debt. Although some media commented that this agreement has been difficult to reach, the reality is that the US House of Representatives has a Democratic majority, so no other outcome was expected. Particularly considering that, if this agreement had not gone ahead, they would be jeopardizing their own economic recovery. Despite this, the initiative received 212 votes against.
Regarding macro data, during yesterday's session, we learned that the preliminary inflation figure for Spain was well above market expectations at 4%, hitting a high not seen in 13 years. This sharp rise in inflation is a clear consequence of the sharp increase in energy costs and as we commented in last Tuesday's analysis, this energy crisis could be the black swan that causes market declines, so we will have to be very attentive to its evolution.
During today's session, we have seen the release of various important macro data from Asia and Europe. If we focus on Europe, we can see that the German unemployment rate was worse than expected at 5.5% versus the expected 5.4%. In the UK, we have learned that during the second quarter GDP grew by 5.5%, 0.7% more than was forecast, setting year-on-year GDP growth at 23.6%.
If we focus on Asia, we should look at the data from China and Japan, highlighting the manufacturing PMI from China and the industrial production index and retail sales from Japan.
For the third consecutive month, China's manufacturing PMI is not only worse than the previous month's figure but also worse than the one expected by the market consensus. In this case, the PMI has entered contractionary territory by settling below 50 points, reaching 49.6 points.
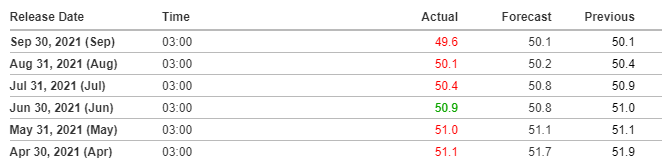
Source: Investing.com
On the Japanese side, both the preliminary industrial production index and retail sales were also worse than last month and also worse than expected by the market consensus at -3.2%. The industrial production index was expected to come in at -0.5% after last months -1.5%. Retail sales fell from 2.4% to -3.2% compared to the expected -1%.
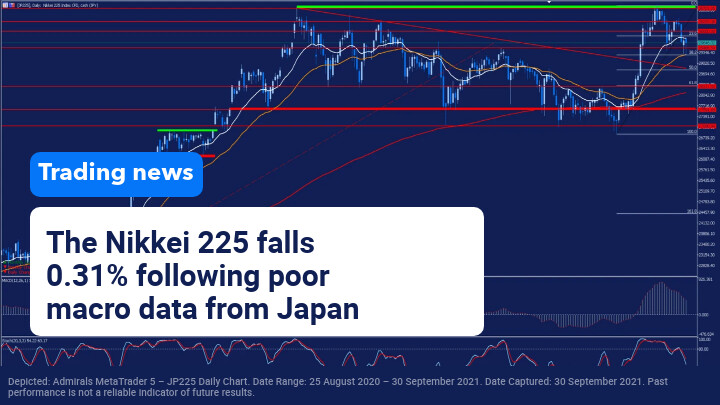
After these results, the Nikkei index has continued with its correction of the last upward momentum, which led it to reach the yearly highs, dropping 0.31% in today's session.
If we look at the daily chart, we can see that the Japanese selective experienced a strong upward momentum that led it to reach its highs, represented by the green resistance band, where it began a correction forming a double top.
This correction has led the price to face its 38.2% Fibonacci retracement level after breaking below its 18-session moving average in white, thus exiting the overbought accumulated after the strong rallies at the beginning of the month.
It is important to keep an eye on this important support level as a break of it could trigger a further correction in search of the coinciding area of its downtrend line, broken at the beginning of the month, and the 50% Fibonacci retracement level.
However, if the price manages to hold these levels, it could be a good point for a new push up to the double top area which acts as its main resistance level.
(Click on image to enlarge)
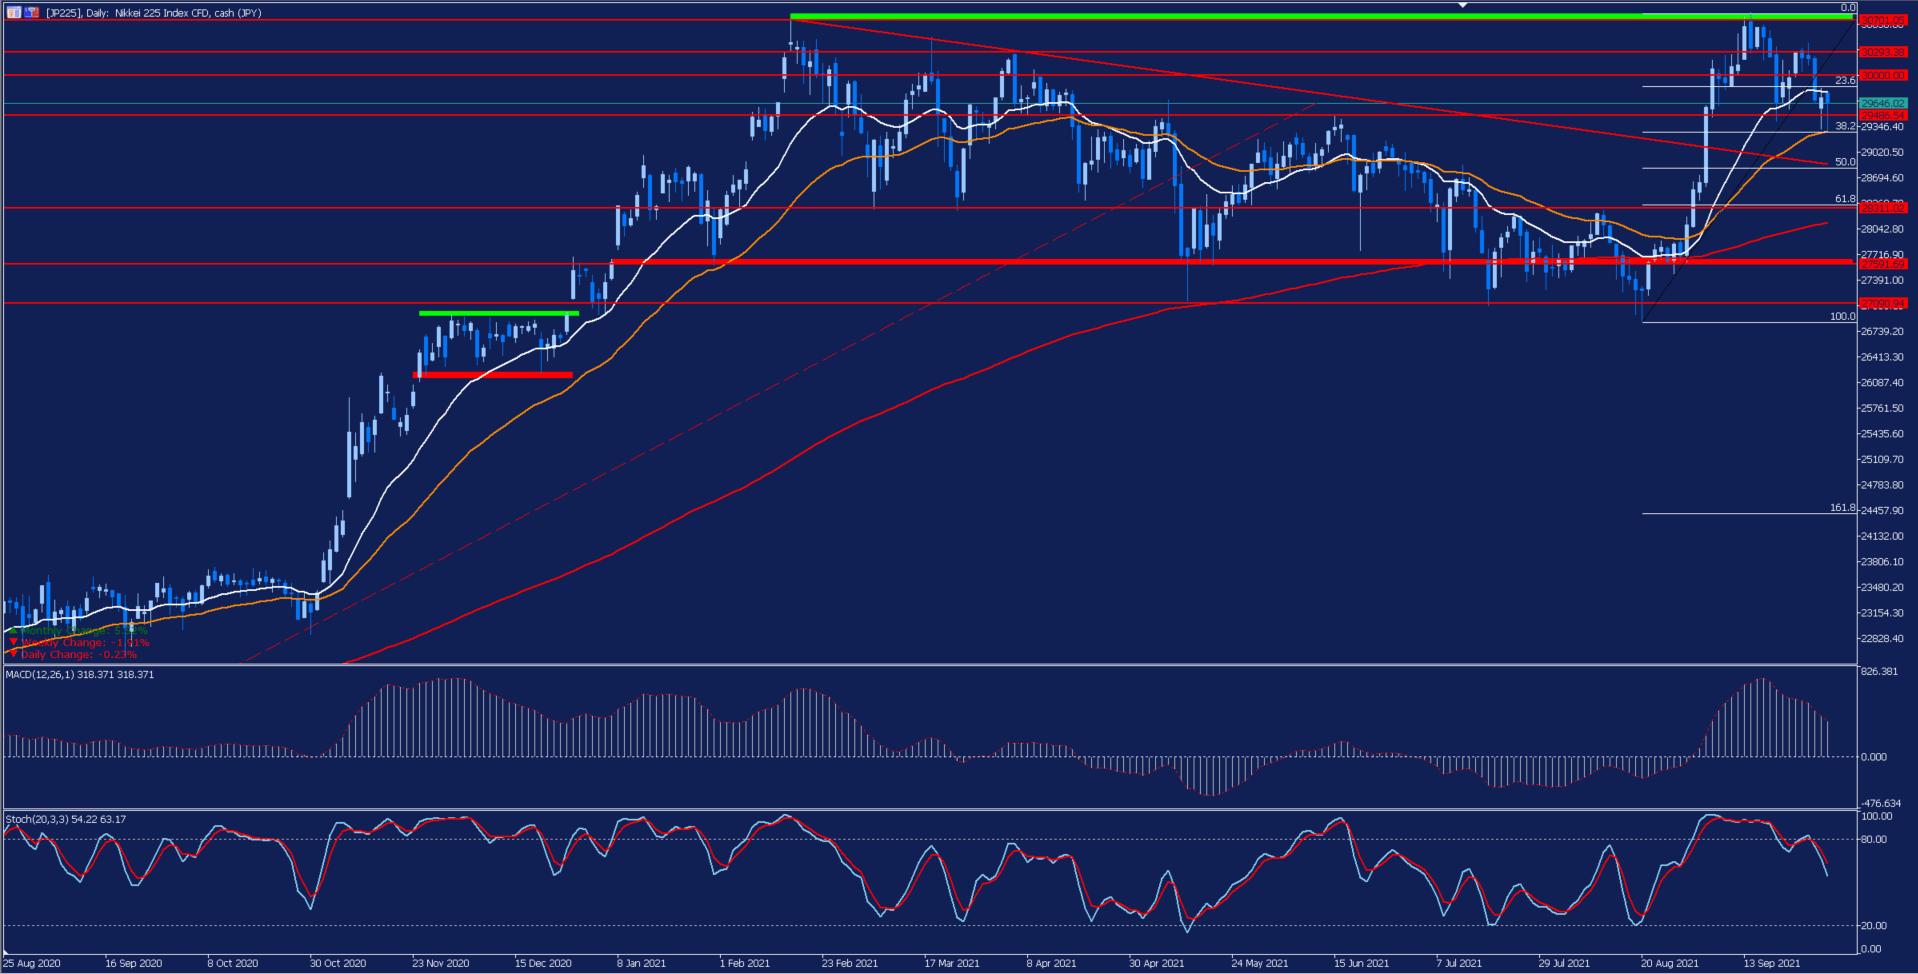
Depicted: Admirals MetaTrader 5 – JP225 Daily Chart. Date Range: 25 August 2020 – 30 September 2021. Date Captured: 30 September 2021. Past performance is not a reliable indicator of future results.
Evolution of the last five years:
- 2020: 16.01%
- 2019: 18.20%
- 2018: -12.08%
- 2017: 19.10%
- 2016: 0.42%
Disclaimer: The given data provides additional information regarding all analysis, estimates, prognosis, forecasts or other similar assessments or information (hereinafter ...
more

