
When The Euro Is Running, European Equities May Be An Obvious Choice
Can Europe ever catch a break?
We are coming up on 13 years of nearly relentless outperformance by U.S. equities relative to counterparts in Europe, owing to the former’s sector skew toward Tech and Communications Services stocks, among other things.
From November 30, 2007 to August 24, 2020, the MSCI Europe Index chalked up total annual returns of 0.9%, a frustrating result when you consider that the Russell 1000 Index of U.S. equities posted gains of 9.2% annually. A large chunk of that gap was that other thing—structural EUR (euro) weakness.
But that reversed about five months ago, on March 20, when the euro turned on a dime and started rallying.
When I think about the beneficiary of a prolonged upturn in EUR, one of our well-positioned strategies is the WisdomTree Europe SmallCap Dividend Fund (DFE).
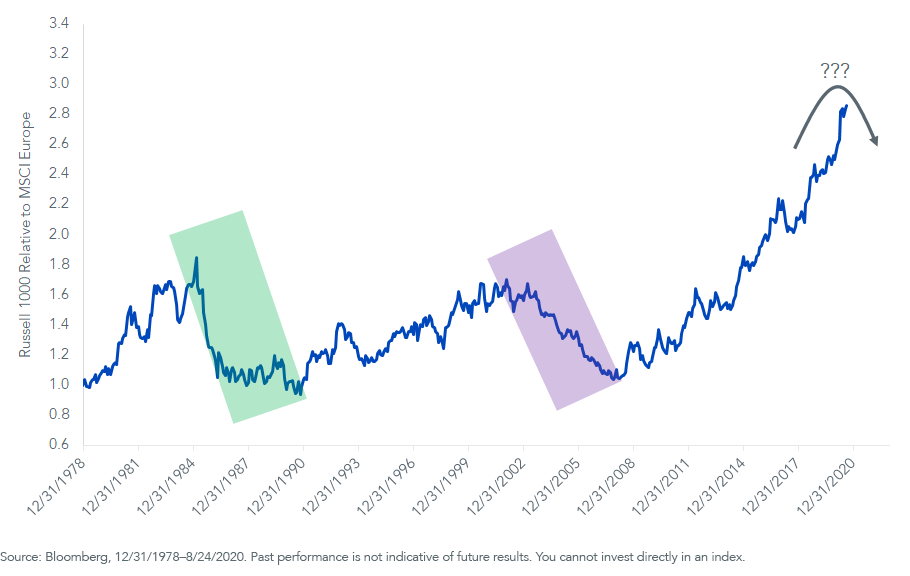
Figure 1 lends credence to my use of the word “relentless” to describe the outperformance of the Russell 1000 relative to MSCI Europe. I highlighted in green and purple the only two sustained bouts of outperformance by European equities over the last four decades (February 1985–July 1990 and January 2002–November 2007).
During the first—shown in the green rectangle—MSCI Europe returned 31.7% annually, about double the 16.3% annualized return of the Russell 1000 over those 65 months. In the purple rectangle, MSCI Europe posted annual returns of 16.6%, again about double the 7.2% of the Russell 1000 Index, this time over 64 months.
Other than those two five-year bouts, we have seen four decades of U.S. equity dominance.
Figure 1: Russell 1000 Relative to MSCI Europe Index
(Click on image to enlarge)
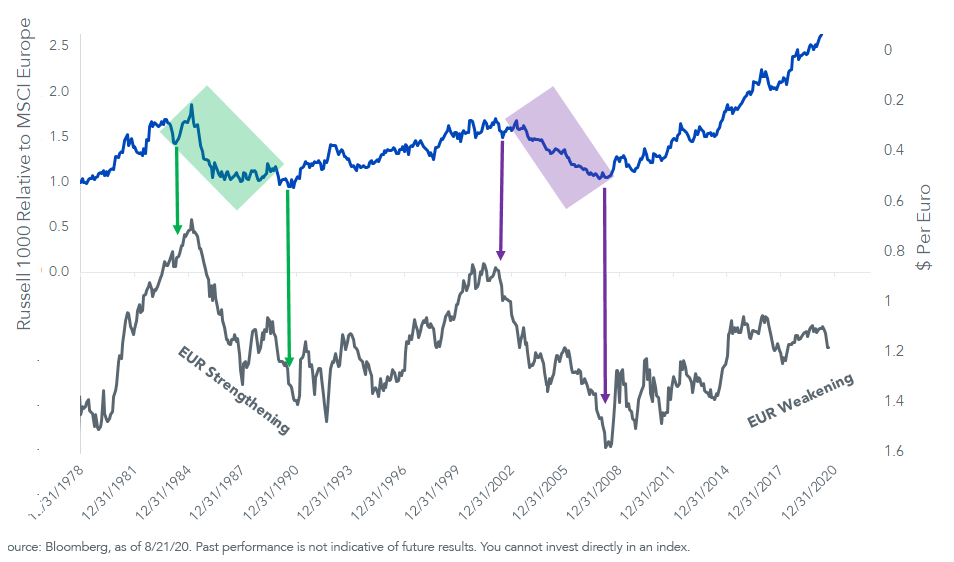
In figure 2, we see that, logically, the green and purple rectangles that marked European equity outperformance coincided with euro appreciation. In contrast, the last 13 years witnessed EUR weakness, hindering European equities’ return relative to U.S. equities.
Figure 2: Russell 1000 Relative to MSCI Europe
(Click on image to enlarge)
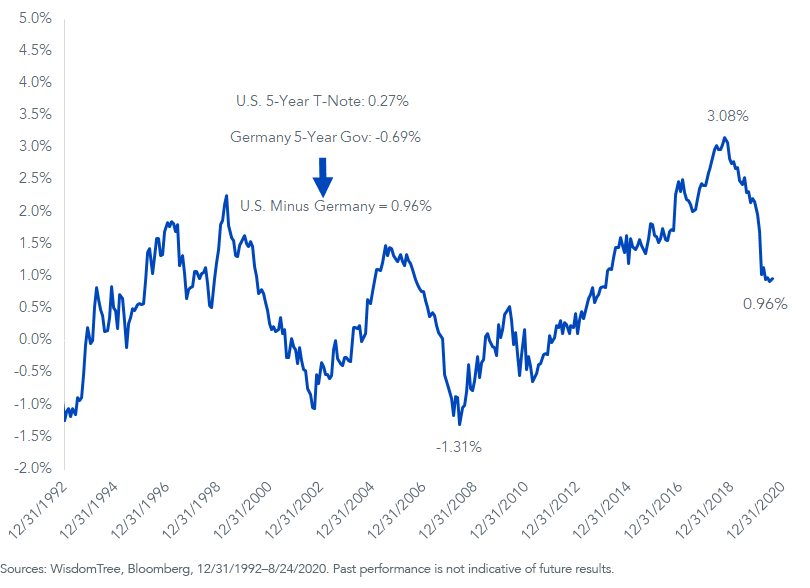
A key impetus for the dollar’s rally since the global financial crisis was an incessant increase in the gap between U.S. bond yields and zero- or negative-yielding European debt.
Back in summer 2008, when the dollar was weak, five-year German bund yields exceeded those of same maturity U.S. Treasuries by 131 basis points (bps). That did not last. By late 2018, it was the other way around, and considerably so: U.S. yields were 308 bps higher. No wonder the U.S. dollar rallied.
But 308 bps of excess yield is distant memory now, available as late as Q4 2018, is a distant memory now. The gap has shriveled to 96 bps (figure 3).
Figure 3: 5-Year U.S. Treasury Yield Minus Germany 5-Year Bund
(Click on image to enlarge)
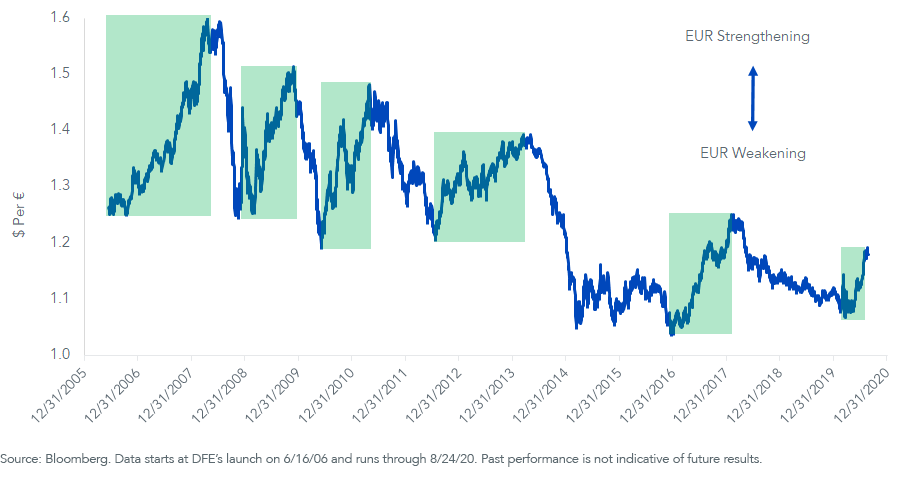
In figure 4, I highlighted in green the six EUR rallies since DFE’s launch in summer 2006. The last one is happening in real time: EUR has popped to $1.181 from $1.069 on March 20. It took notice of our 2020 reality: Everyone is running a zero interest rate policy these days, so the hunt-for-yield appeal of the USD (U.S. dollar) is gone.
Figure 4: EURUSD
(Click on image to enlarge)
Here is where it gets fun.
Figure 5 shows how DFE performed during those six EUR rallies.
I had to keep double- and triple-checking the math to confirm that European stocks did in fact return so much during those windows of time. The primary reason for such large returns is because the euro is associated with “risk-on” sentiment. You often see it rallying at the same time as the stock market, causing big performance runs that raise eyebrows when sentiment is on the upswing.
Critically, compare the European funds and indexes to the S&P 500. If you are bullish EUR, this is a guidepost.
Figure 5: DFE During Highlighted EUR Rallies
(Click on image to enlarge)
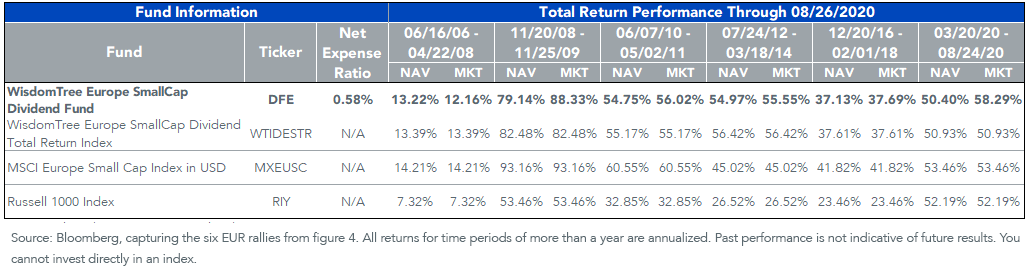
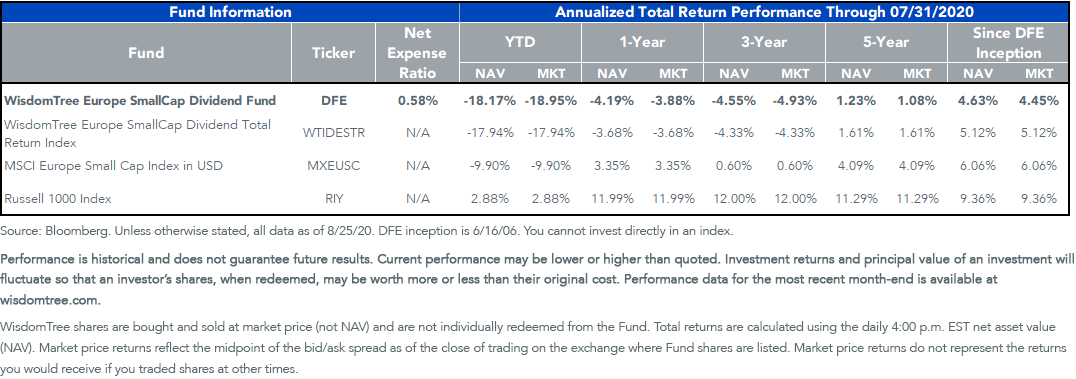
Figure 6 shows performance over the entire window since DFE launched more than 14 years ago.
No robust gains here, at least not for European equities—and this is inclusive of all those big gains in the table above. The dollar was “on” for basically that entire time—and you better believe the S&P 500 was too.
Figure 6: Performance
(Click on image to enlarge)
If you think the dollar keeps running from here, your answer may be simple: Stick with what has worked.
But what if the euro’s five-month rally turns into something like a five-year rally, as was the case from 1985–1990 and from 2002–2007? That’s a different story.
Remember the green and purple rectangles in the charts above. It happens.
Disclaimer: Investors should carefully consider the investment objectives, risks, charges and expenses of the Funds before investing. U.S. investors only: To obtain a prospectus containing this ...
more

