
Weekly Technical Perspective On NZD/USD, GBP/USD And EUR/NZD
In this series, we scale-back and take a look at the broader technical picture to gain a bit more perspective on where we are in trend. Here are the key levels that matter on the weekly charts for the NZD/USD, GBP/USD and EUR/NZD.
NZD/USD WEEKLY PRICE CHART
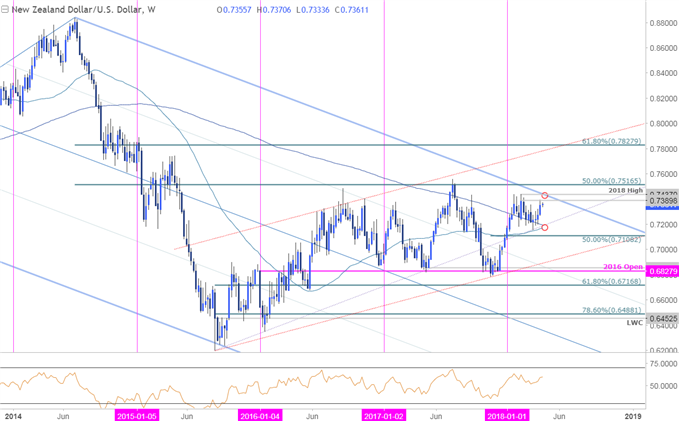
Notes: Last month we noted that the New Zealand Dollar had,“continued to consolidate below the January highs at 7436 with the 200-week moving average catching the closes on the downside over the past few months. I’m looking for a resolution to this key price range over the coming weeks with key support (bullish invalidation) eyed at 7094-7140.”
Price registered a low 7153 before turning higher with the advance now eyeing range resistance at 7390(yearly high-close) and 7437 (yearly high)- note that the upper median-line parallel of the descending pitchfork (blue) AND the objective yearly opening-range high converge on this zone and weekly breach/ close would be needed to validate a larger breakout in Kiwi.
Bottom Line: Price is approaching confluence down-trend resistance and the yearly range highs- Look for a reaction at this level with the immediate long-bias at risk while below. Key support remains at the 2015 slope support which converges on the 52 & 200-week moving averages at 7170/90.
GBP/USD WEEKLY PRICE CHART
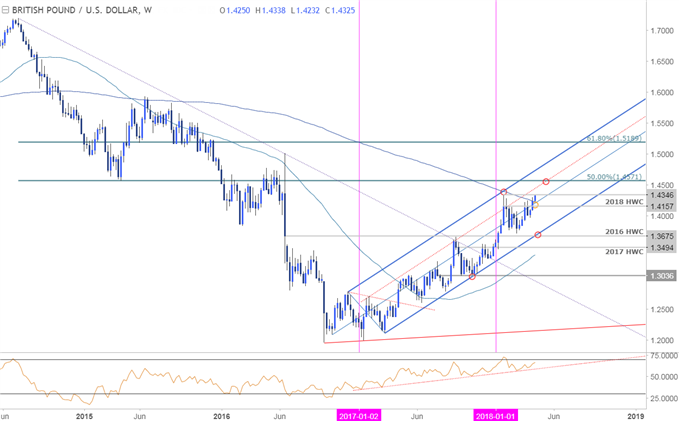
Notes: Simplicity is key! We’ve been tracking this ascending pitchfork formation extending off the 2016 / 2017 lows for over a year now in the British Pound. Our Bottom Line last month noted that “a breach / close above the 2018 high-day close at 1.4134 would keep the long-bias in play targeting the 200-week moving average at ~1.4280s and the yearly high at 1.4346.” Price is within striking distance of the 1.4346 target after breaking above the median-line last week- look for a reaction there.
Bottom line: The immediate focus is on yearly highs here with a breach targeting the sliding parallel (red) around ~1.4450s and the upper median-line parallel (blue) at ~1.4730s. Interim support rests with the high-day close at 1.4157 broader bullish invalidation, unfortunately still down at 1.3675. Looking for re-entries on a larger pullback.
GBP/USD IG CLIENT POSITIONING
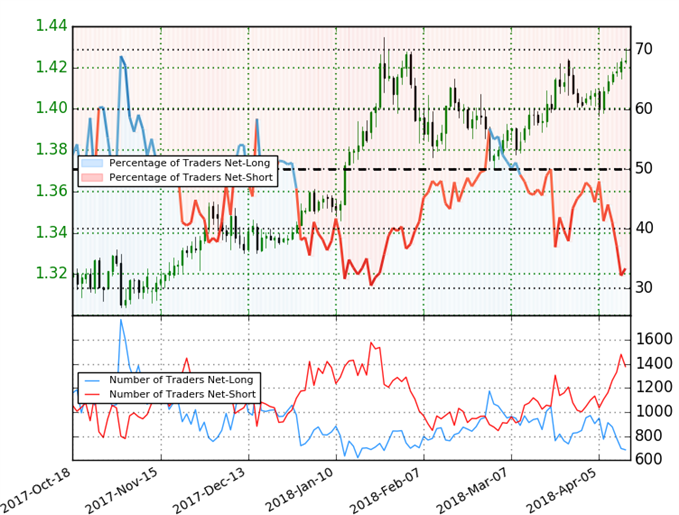
- A summary of IG Client Sentiment shows traders are net-short GBPUSD- the ratio stands at -2.01 (33.3% of traders are long) – bearish reading
- Retail has remained net-short since Mar 21st; price has moved 2.7% higher since then
- Long positions are 8.7% lower than yesterday and 28.8% lower from last week
- Short positions are 5.0% lower than yesterday but 15.6% higher from last week
- We typically take a contrarian view to crowd sentiment, and the fact traders are net-short suggests GBPUSD prices may continue to rise. Traders are further net-short than yesterday and last week, and the combination of current positioning and recent changes gives us a stronger GBPUSD-bullish contrarian trading bias from a sentiment standpoint.
EUR/NZD WEEKLY PRICE CHART
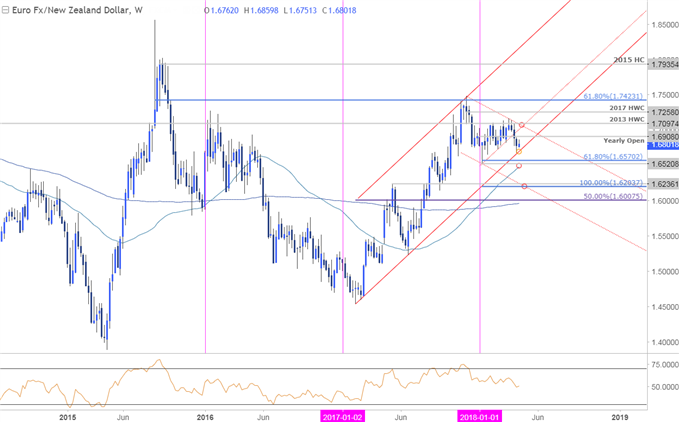
Notes: EUR/NZD is trading just above slope support extending off the 2017 lows and is backed closely 1.6521/70- a region defined by the yearly range lows and the 61.8% extension of the decline off the 2017 highs. I’m looking for a reaction here (looking for a near-term low at one of these levels) - a break below this objective zone would suggest a more significant high is in place with subsequent support targets eyed at 1.6204/36.
Interim resistance stands at the yearly open at 1.6908 with bearish invalidation eyed at 1.7097 where the 2013 high-week close converges on basic slope resistance. A breach there would put the broader long-bias back in focus targeting 1.7258 and 1.7423.
Bottom line: There’s no play here just yet, but it’s make-or-break for EUR/NZD with the immediate focus on basic slope support. Note that weekly momentum has largely held above 50 since the early 2017 lows – a break below alongside break of the yearly opening-range in price would be a compelling signal for further weakness. That said, from a trading standpoint, I’ll be looking to fade weakness while above this threshold for now.


