
VIX ‘Fear-Gauge’ Hits Crisis Highs Amid Cross-Asset Volatility Explosion
VIX, OVX, VXEEM, GVZ, TYVIX, FXVIX: CROSS-ASSET VOLATILITY BENCHMARKS GO NUCLEAR AS GLOBAL RECESSION RISK INTENSIFIES
- The VIX Index, a popular investor fear-gauge, trades around its highest since the 2008 global financial crisis as the S&P 500 crashes into a bear market
- Alongside the VIX Index, FX volatility is surging, which speaks to the rise in systemic risk amid the novel coronavirus outbreak and crude oil price war
- Equities could remain under pressure if market volatility lingers around record high readings, but that might catalyze demand for gold and the US Dollar
The VIX Index, which reflects expected volatility on the S&P 500 over the next 30-days, just notched its highest weekly close since 2008 amid the global financial crisis. The VIX Index is often used to quantify stock market volatility – or perceived risk and uncertainty – faced by traders. As such, there is generally an inverse relationship between measures of volatility and investor sentiment.
Historical Volatility: A timeline of the Biggest Volatility Cycles
CORONAVIRUS PANDEMIC SPARKS SURGE IN CROSS-ASSET VOLATILITY MEASURES (CHART 1)
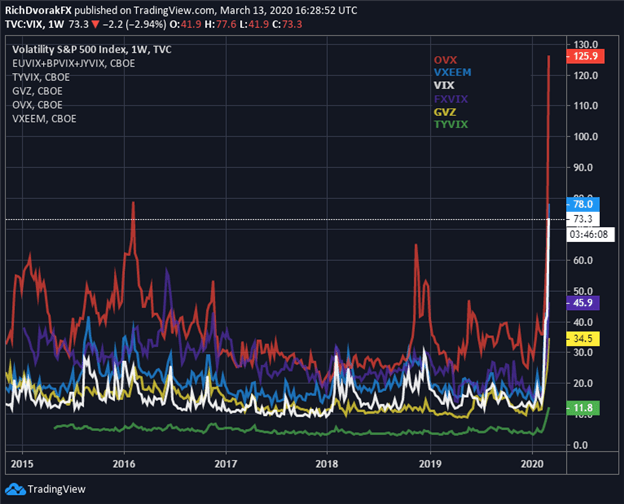
Chart created by @RichDvorakFX with TradingView
The VIX Index and other cross-asset volatility benchmarks began their latest ascent earlier this year, owing to the novel coronavirus outbreak, which caused a major disruption to the global supply chain and rekindled recession risk.
Now, economic fallout from the novel coronavirus, or COVID-19, is starting to snowball as international trade, travel and business activity come to a standstill. This has corresponded with a deterioration in market sentiment and jump in volatility.
VIX INDEX SPIKES TO FINANCIAL CRISIS LEVELS AS S&P 500 INDEX PLUNGES INTO BEAR MARKET (CHART 2)
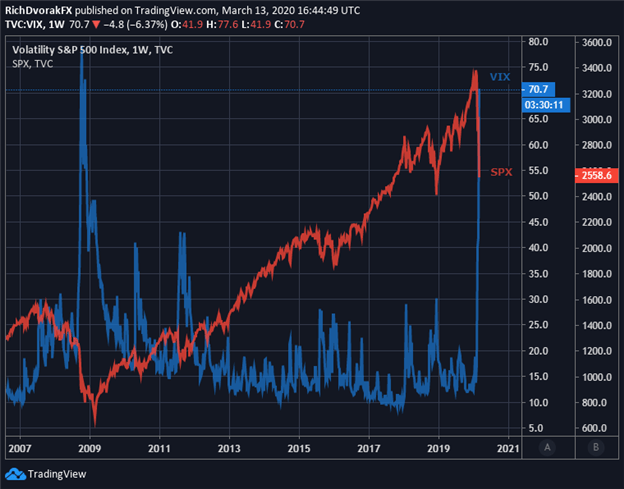
Chart created by @RichDvorakFX with TradingView
Meanwhile, stock market turmoil has sent the S&P 500 Index into a tailspin. The infamous equity benchmark trades right around bear market territory following its 20% plunge from all-time highs printed on February 19 – a day after I noted stocks looked set to slide.
| CHANGE IN | LONGS | SHORTS | OI |
| DAILY | -19% | 20% | -3% |
| WEEKLY | -7% | -16% | -12% |
Unless there is a material retracement lower in volatility, the S&P 500 and other US stock market indices like the Dow Jones or Nasdaq could remain under pressure while the VIX Index, or fear gauge, lingers around crisis-high levels.
OIL VOLATILITY JUMPS TO RECORD HIGH FUELED BY CORONAVIRUS, OIL PRICE WAR (CHART 3)
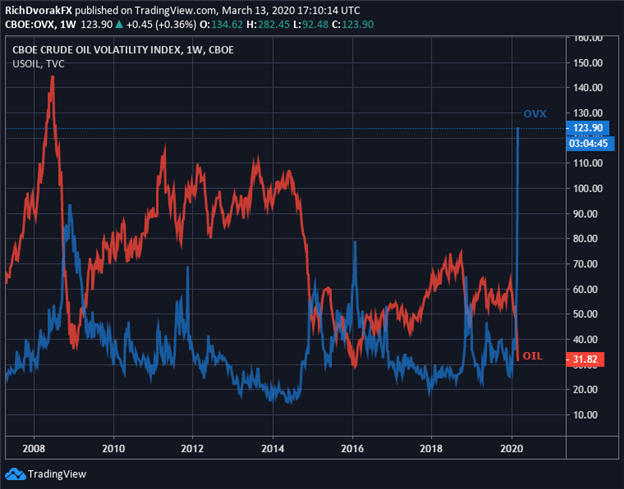
Chart created by @RichDvorakFX with TradingView
In addition to the coronavirus pandemic, the ongoing crude oil price war is another black swan event propelling the surge in market volatility readings. Recession risk intensifies on the back of cratering crude oil prices due to the resulting strain on US shale producers and high-yield corporate debt.
The crash in crude oil is also weighing negatively on emerging markets and other developed nations heavily depended on oil exports. For example, the US Dollar has soared relative to the Mexican Peso and Canadian Dollar with USD/MXN and USD/CAD price action up 3% and 9% respectively since March 06.
EMERGING MARKETS PRESSURED BY CRUDE OIL PRICE CRASH & WIDESPREAD RISK AVERSION (CHART 4)
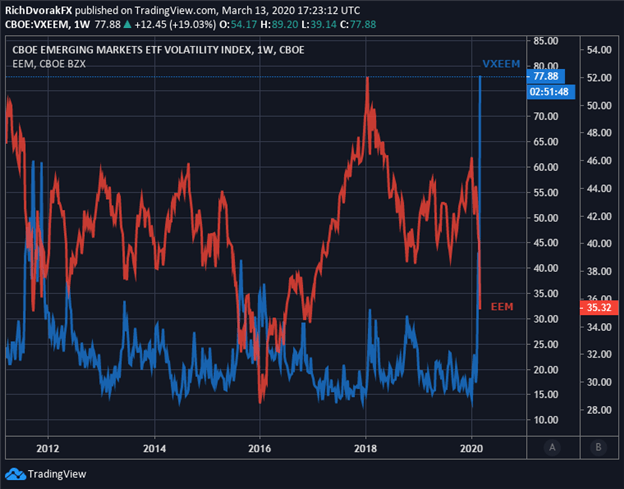
Chart created by @RichDvorakFX with TradingView
Weakness in global equities is noteworthy across emerging markets as well. The emerging markets volatility index, or VXEEM, just notched an all-time record close as the iShares Emerging Markets ETF (Ticker Symbol: EEM) plunged to a 39-month low.
If risk-aversion continues to run rampant and financial conditions tighten, emerging market stocks could keep bleeding. That said, the direction of volatility and these emerging market currencies might serve as potential bellwethers to investor sentiment and where EM equities head next.
GOLD PRICE SINKING DESPITE SKYROCKETING VOLATILITY (CHART 5)
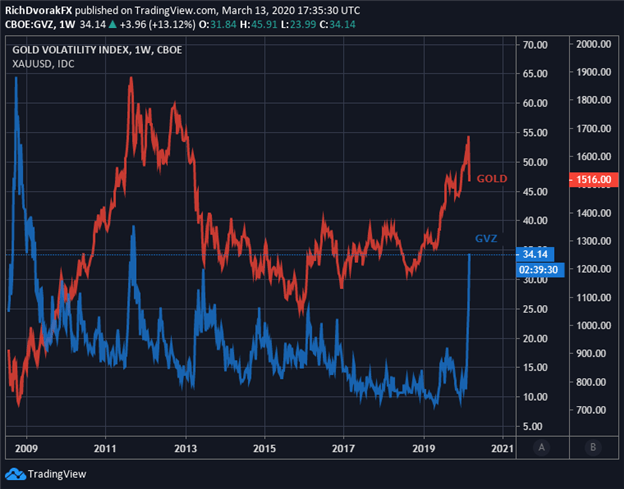
Chart created by @RichDvorakFX with TradingView
In contrast to the typical negative correlation between volatility and a given underlying market, there is generally a strong direct relationship between gold and volatility. This is largely attributed to the precious metal’s posturing as a safe-haven asset. Although, the price of gold has interestingly pulled back this past week despite a sky-high VIX Index and gold volatility, or GVZ.
I recently noted that the stock market rout pressured gold lower, which might be explained by need for cash amid accelerating liquidity concerns and possible equity margin calls. Weakness in spot gold price action could prove short-lived, however, considering the potential for bullion to near its record high as yields collapse and volatility rages.
BOND MARKET VOLATILITY HINTS AT SYSTEMIC LIQUIDITY ISSUES WHILE TREASURY YIELDS TRADE NEAR RECORD LOWS (CHART 6)
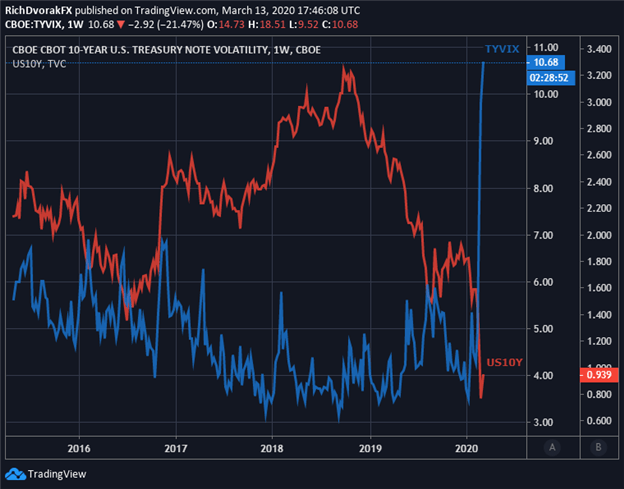
Chart created by @RichDvorakFX with TradingView
Bond market volatility, measured using the 10-Year Treasury note volatility index, or TYVIX, also underscores the explosion in cross-asset volatility. The unprecedented drop in sovereign US interest rates to historic lows highlights the degree of anti-risk sentiment as well.
Moreover, recent activity in Treasuries and bonds speaks to underlying market liquidity issues, which even prompted the Fed to unleash a $1.5 trillion cash injection via repo operations in aims to calm market angst. Markets might face further bond market volatility and significant swings in US Treasury yields in light of the Fed meeting scheduled next week.
The Fed is slated to release its latest interest rate decision and update to the Summary of Economic Projections (SEPs) provided by FOMC officials this coming Wednesday, March 18 at 18:00 GMT. As such, gyrations in US Treasuries over coming trading sessions might foretell the general direction of cross-asset volatility.
FX VOLATILITY CLIMBS AS US DOLLAR, EURO, STERLING & YEN SWING (CHART 7)
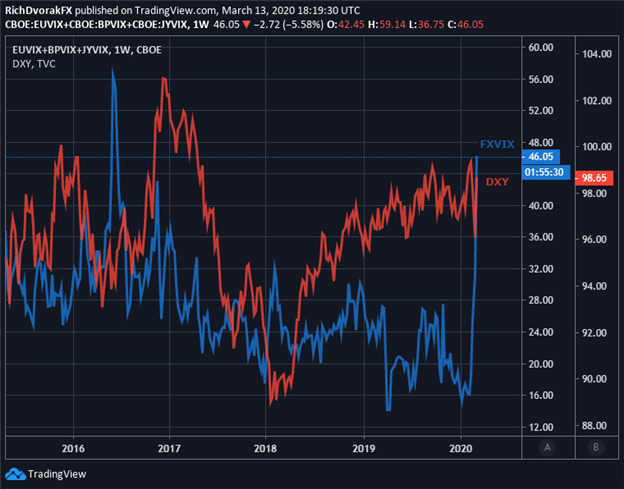
Chart created by @RichDvorakFX with TradingView
That said, the meteoric rise in the VIX Index is given more credence considering the paralleled spike in currency volatility, or FX volatility. One of the several advantages of trading the FX market is of liquidity due to the ability to trade 24-hours a day during the week.
Currency volatility (FXVIX), tracked with an index combining the 30-day implied volatility readings for the Euro (EUR), Pound Sterling (GBP) and Japanese Yen (JPY), just hit a 45-month high as FX volatility returns with vengeance.
This speaks to systemic uncertainty that has infected investor risk appetite, which might foreshadow a prolonged rally in the US Dollar (USD) given its status as the ultimate safe-haven currency.


