
USD/ZAR Outlook: Doubtful South African Rand Centers On FOMC
Rand Analysis
- Rand at mercy of global risk sentiment.
- Focus on China and U.S. next week.

ZAR Fundamental Backdrop
After a strong past week for USD/ZAR bulls, the week ahead provides many fundamental drivers that could provide forward guidance for the Emerging Market (EM) currency. Recent positive jobless claims data and flat CPI prints have left markets undecided. Unfortunately for ZAR supporters, the slight impetus gained after the CPI announcement was not enough to overcome the better than expected jobless claims. In particular, direction on Fed QE tapering will be the focal point as the FOMC meets on Wednesday (see calendar below).
From a South African perspective, inflation (see calendar below) and retail sales data for July and June respectively will have rand followers engrossed. Inflation for July will be an interesting statistic as markets look to see whether or not the recent riots had any impact. These may have some influence on USD/ZAR but more emphasis should be placed on the FOMC meeting later in the day. Positions should be effectively managed using proper risk technique as volatility is expected both pre and post-announcement.
USD/ZAR Economic Calendar

Source: Refinitiv
With China struggling to deal with the COVID-19 delta variant as new cases rise, pressure is weighing on commodities globally. China being a key trading partner for South Africa; the demand for local exports (iron ore, platinum, gold etc.) will likely decline thus adversely affecting the rand.
Technical Analysis
USD/ZAR Daily Chart
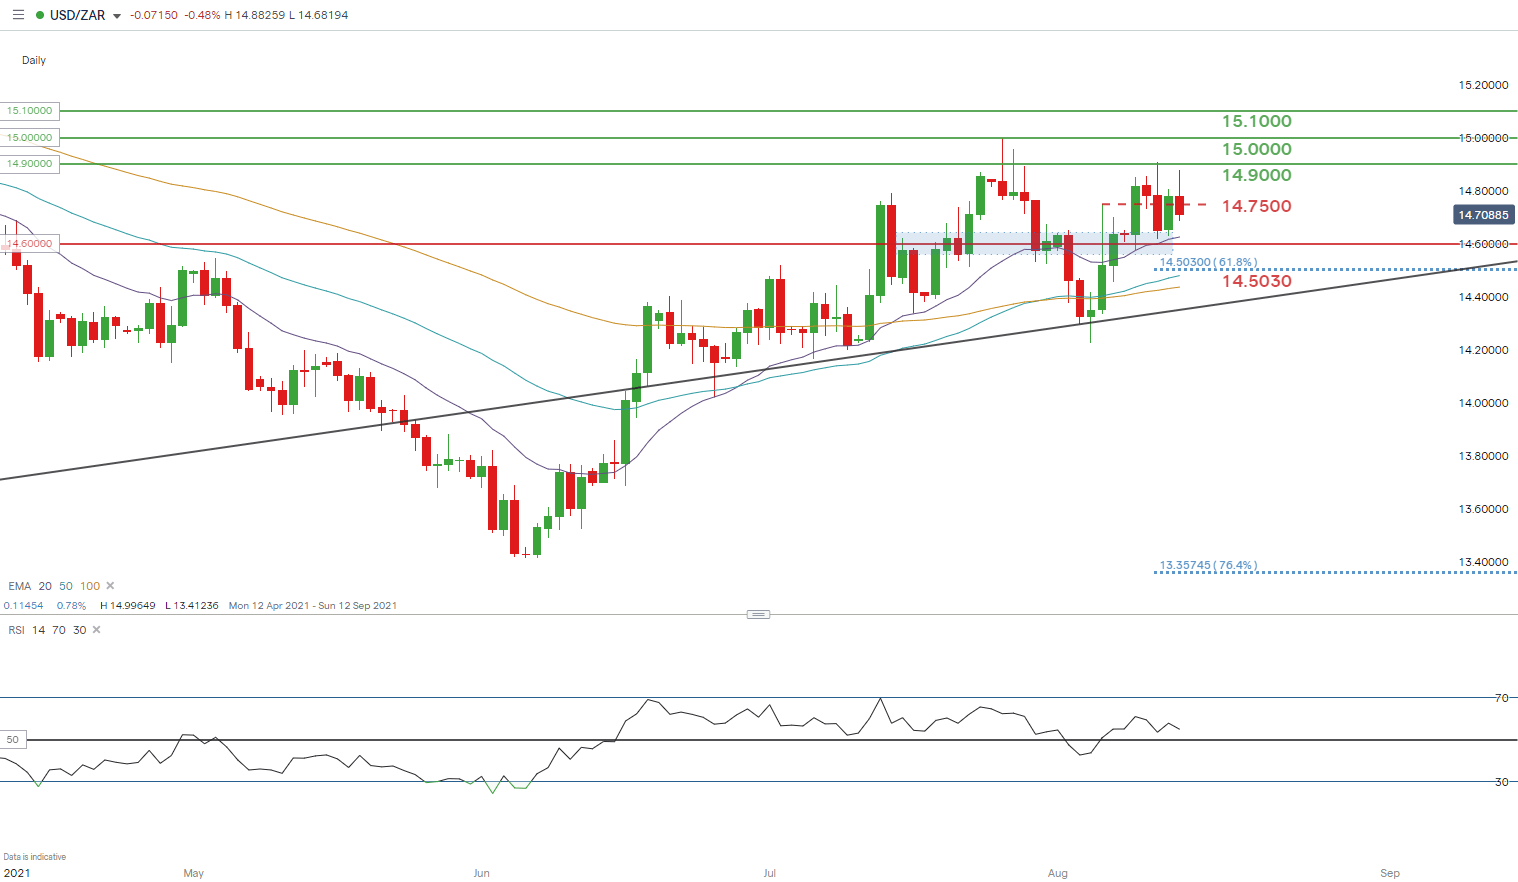
Chart prepared by Warren Venketas, IG
The daily chart shows a firm trendline support (black) holding up any rand strength since mid-June. Last weeks bullish run is clear with a test of the 14.9000 handle. The 20-day EMA has been key this week which is respected as short-term support - coinciding with the 14.6000 confluence zone (blue) which has been an area of both support and resistance. A close below these key levels could trigger a downward move to the 14.5000 psychological zone.
A bullish outcome from the economic data throughout the week may see a subsequent push to 14.9000 and beyond to the July swing high around 15.0000.
Resistance levels:
- 15.0000
- 14.9000
Support levels:
- 14.7500
- 20-day EMA (purple)
Disclaimer: See the full disclosure for DailyFX here.


