
USDJPY Weekly Analysis – Sunday, Sept. 13
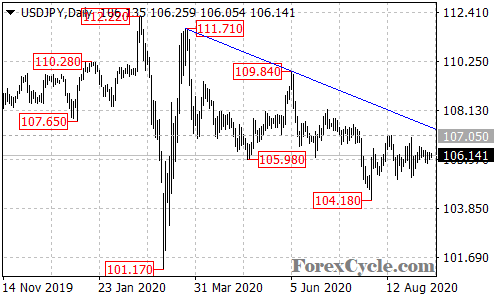
USDJPY moved sideways in a trading range between 104.18 and 107.05. As long as the price is below the falling trend line on the daily chart, the downside movement from 111.71 could be expected to continue and the next target would be at the 103.00 area. Only a break above the trend line resistance could signal completion of the downtrend.
How did you like this article? Let us know so we can better customize your reading experience.

Comments
Leave a comment to automatically be entered into
our contest to win a free Echo Show.

