
USDJPY Weekly Analysis – Sunday, Dec. 9
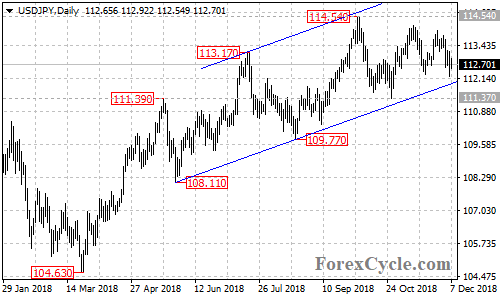
USDJPY moved sideways in a trading range between 111.37 and 114.54 for several weeks. As long as the price is in the rising price channel on the daily chart, the sideways movement could be treated as consolidation for the uptrend from 104.63 and a further rise towards 115.50 resistance is still possible after the consolidation.
Key support is at 111.37, only a breakdown below this level would indicate that the upside movement had completed at 114.54 already, then the pair would find the next support at around 109.50.
How did you like this article? Let us know so we can better customize your reading experience.

Comments
Leave a comment to automatically be entered into
our contest to win a free Echo Show.

