
USD/JPY Weekly Analysis – Sunday, August 12
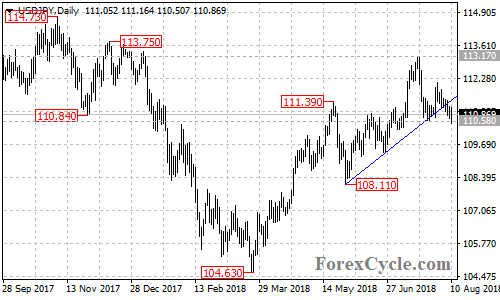
USD/JPY broke below the rising trend line on the daily chart, suggesting the upside movement from 104.63 to as high as 113.17.
A deeper decline would likely be seen in a couple of weeks and the next target would be at 109.50 area.
Resistance levels are at 112.20 and 113.17, only a break above these levels could trigger another rise towards 115.50 resistance.
How did you like this article? Let us know so we can better customize your reading experience.

Comments
Leave a comment to automatically be entered into
our contest to win a free Echo Show.

