
USD/JPY To Track October Range As Attention Turns To U.S. CPI
FUNDAMENTAL FORECAST FOR JAPANESE YEN: BULLISH
JAPANESE YEN TALKING POINTS
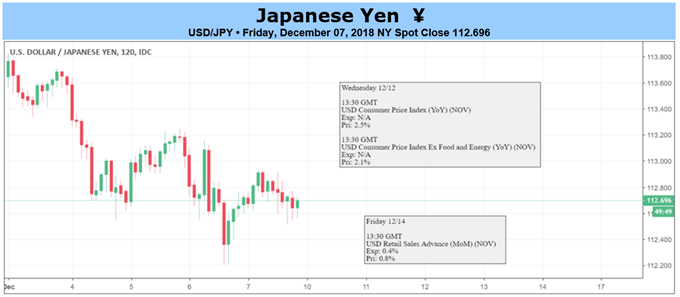
USD/JPY struggles to hold its ground following the U.S. Non-Farm Payrolls (NFP) report as the updates highlight a slowdown job growth, and another batch of lackluster data prints may trigger a further depreciation in the exchange rate as the Consumer Price Index (CPI) is expected to narrow to 2.2% from 2.5% in October.
he 155K expansion in U.S. employment remains a far cry from figures seen during a recession, but the steady 3.1% print for Average Hourly Earnings does little to boost the outlook for demand-pull inflation especially as the updates to the U. of Michigan Confidence survey show 12-month inflation expectations easing to 2.7% from 2.8% in November.
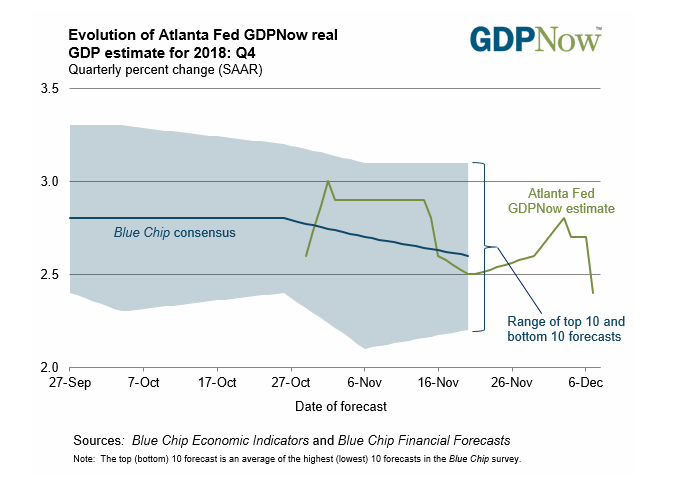
In response, the Atlanta Fed GDPNow model now forecasts the U.S. economy to grow 2.4% per annum in the fourth-quarter of 2018 versus 2.7% on December 6, and signs of slower growth may push the Federal Open Market Committee (FOMC) to deliver a dovish rate-hike later this month as officials see a limited risk for above-target inflation.
Recent comments from Vice-Chairman Richard Clarida suggest the central bank is nearing the end of the hiking-cycle as Fed officials ‘are focused on keeping inflation away from disinflation,’ and an uptick in the core CPI may start to undermine the outlook for private-sector consumption as households face higher borrowing-costs paired with limited wage growth.
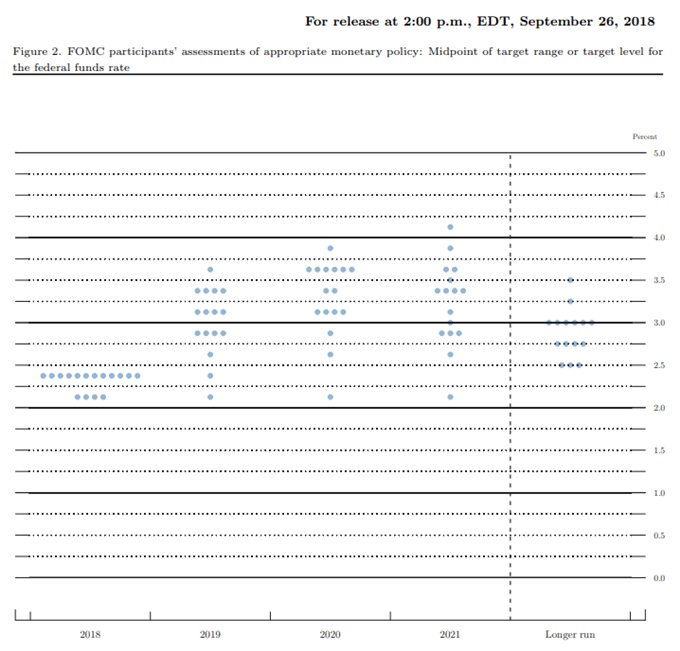
With that said, Chairman Jerome Powell & Co. may continue to project a neutral interest rate of 2.75% to 3.00% as the shift in U.S. trade policy boosts import prices, but the central bank may start to alter its tune over the coming months in response to signs of a slowing economy.
As a result,the October range remains in focus ahead of the Fed interest rate decision on December 19, with USD/JPY at risk for further losses as the exchange rate marks another failed attempt to test the 2018-high (114.55).
USD/JPY DAILY CHART
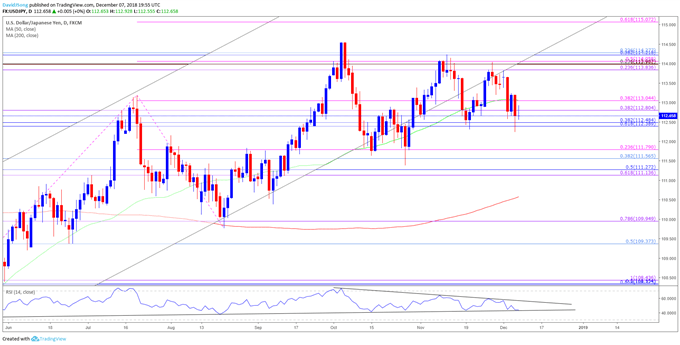
The advance from the October-low (111.38) may continue to unravel as the exchange carves a series of lower highs during the first full-week of December, but need a break/close below the 112.40 (61.8% retracement) to 113.00 (38.2% expansion) region to open up the Fibonacci overlap around 111.10 (61.8% expansion) to 111.80 (23.6% expansion).
Keep in mind, the Relative Strength Index (RSI) warns of range-bound conditions as it appears to be stuck in a triangle/wedge formation, but the oscillator may ultimately flash bearish signals over the coming days as it quickly approaches trendline support.
Disclosure: Sign up and join DailyFX Currency Analyst David Song LIVE for an opportunity ...
more

