
USD/JPY Attempts To Reverse Ahead Of Monthly Low With US PCE On Tap
Japanese Yen Talking Points
USD/JPY appears to be stuck in a narrow range as longer dated US yields remain under pressure. But fresh data prints coming out of the US may influence the exchange rate as the Federal Reserve braces for a transitory rise in inflation.
USD/JPY Attempts to Reverse Ahead of Monthly Low With US PCE on Tap
USD/JPY is little changed from the end of last week as the 10-Year US Treasury yield slips below the 50-Day SMA (1.63%), but lack of momentum to test the monthly low (108.34) may keep the exchange rate within a defined range as the Federal Open Market Committee (FOMC) insists that “the economy was still far from the Committee's longer-run goals.”
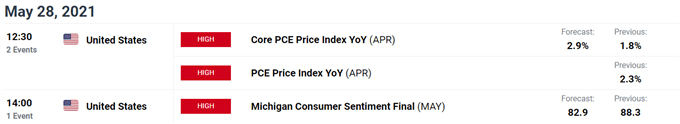
The update to the US Personal Consumption Expenditure (PCE) Index may influence USD/JPY as the core rate is expected to widen to 2.9% from 1.8% in March. A material rise in the Fed’s preferred gauge for inflation may spark a bullish reaction in the US Dollar as it puts pressure on Chairman Jerome Powell and Co. to adjust the forward guidance for monetary policy.
It seems as though there will be a growing discussion within the FOMC on when to switch gears as Vice Chair Richard Clarida pledges to “give advance warning” before scaling back the emergency measures.
The looming update to the Summary of Economic Projections (SEP) may highlight a less dovish outlook as “a number of participants suggested that if the economy continued to make rapid progress toward the Committee's goals, it might be appropriate at some point in upcoming meetings to begin discussing a plan for adjusting the pace of asset purchases.”
Until then, USD/JPY may face range bound conditions as longer-dated US yields remain under pressure, but the ongoing flip in retail sentiment raises the scope for a further decline in the exchange rate as the crowding behavior from 2020 appears to be resurfacing.
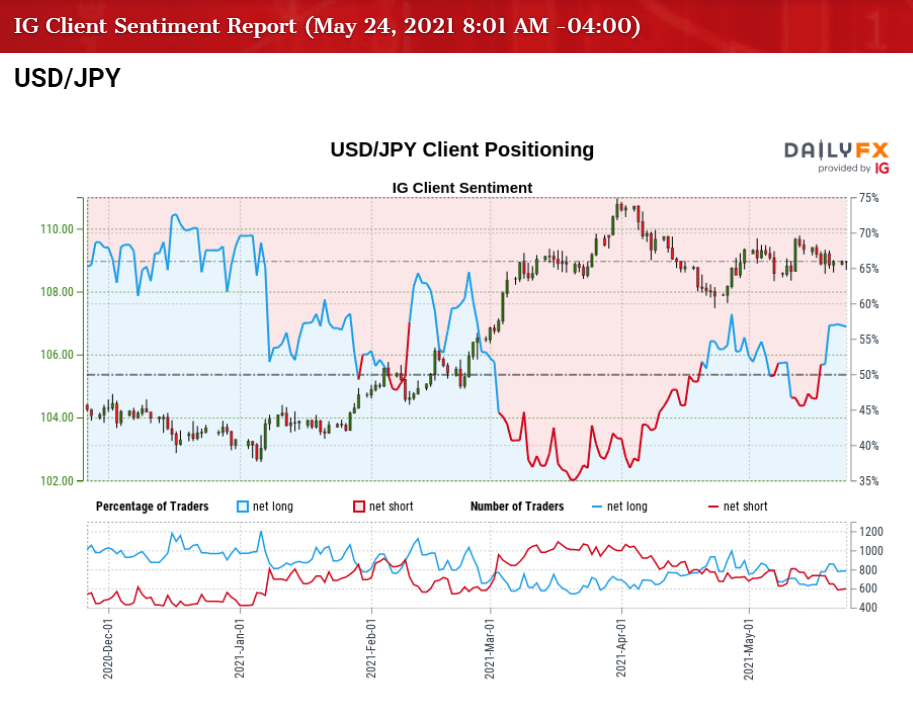
The IG Client Sentiment report shows 56.12% of traders are currently net-long USD/JPY, with the ratio of traders long to short standing at 1.28 to 1. The number of traders net-long is 3.64% higher than yesterday and 18.88% higher from last week, while the number of traders net-short is 6.26% higher than yesterday and 16.02% lower from last week.
The jump in net-long position has spurred a flip in retail sentiment as 47.47% of traders were net-long USD/JPY last week, while the decline in net-short interest comes as the exchange rate appears to be reversing course ahead of the monthly low (108.34).
With that said, it remains to be seen if the decline from the March high (110.97) will turn out to be a correction rather than a change in trend as the crowding behavior from 2020 appears to be resurfacing, but the exchange rate may continue to trade within the confines of the monthly range as the move above the left shoulder largely removes the threat of a head-and-shoulders formation.
USD/JPY Rate Daily Chart
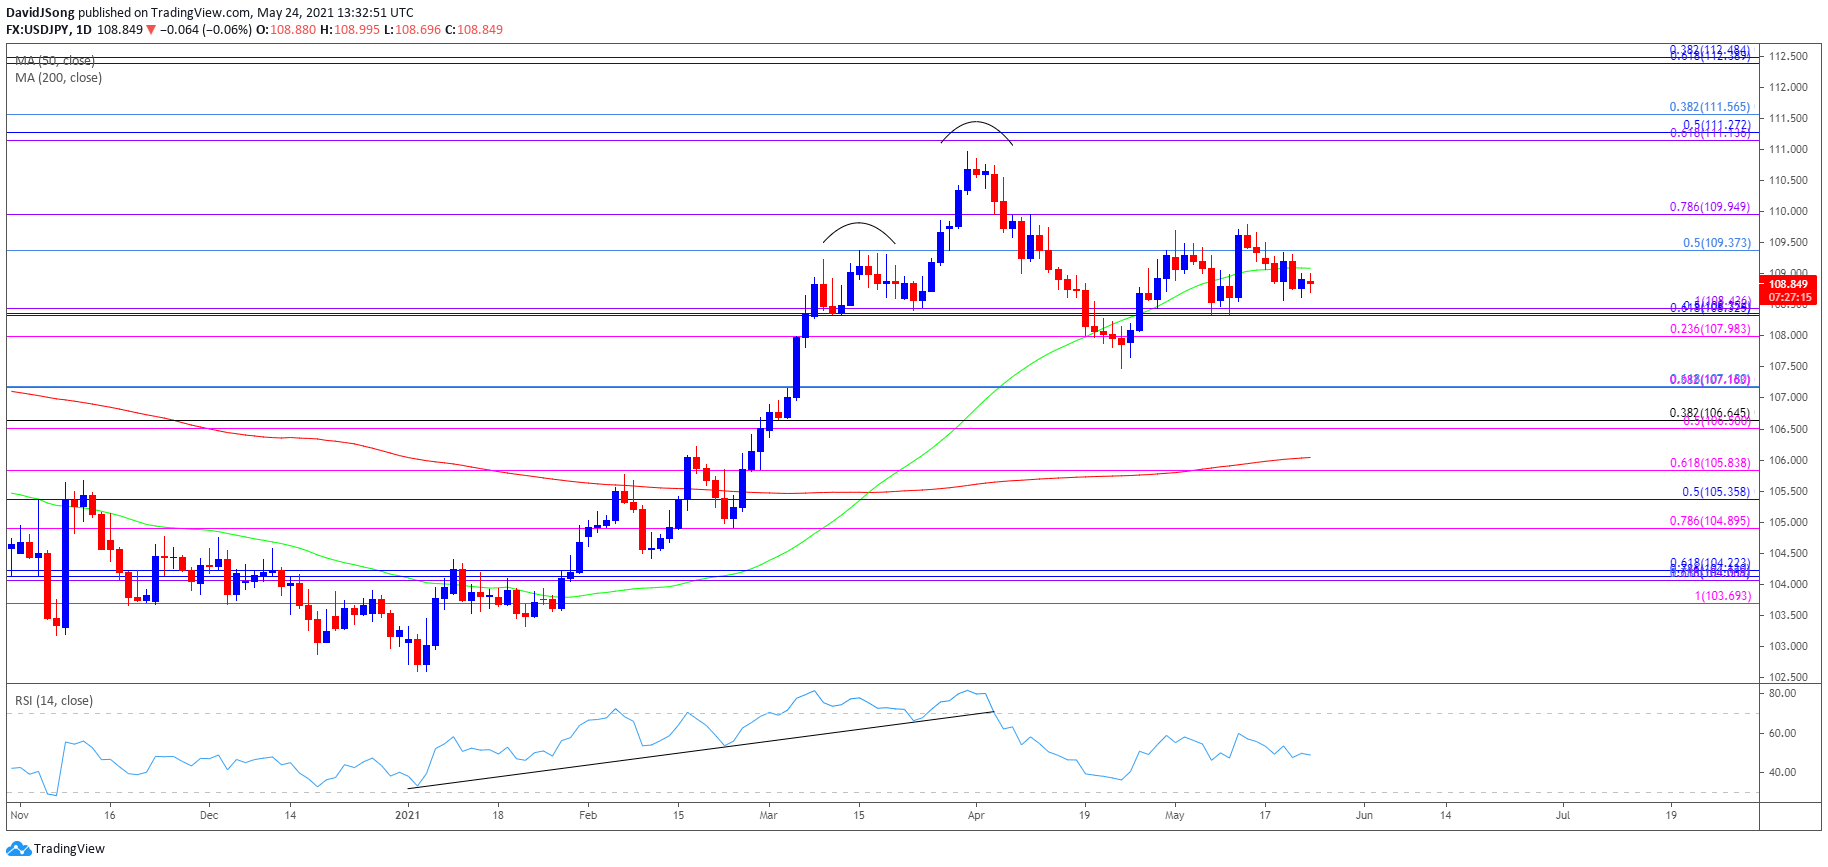
Source: Trading View
USD/JPY approached pre-pandemic levels as a ‘golden cross’ materialized in March, with a bull flag formation unfolding during the same period as the exchange rate traded to a fresh yearly high (110.97). The Relative Strength Index (RSI) showed a similar dynamic as the indicator climbed above 70 for the first time since February 2020, but the pullback from overbought territory has negated the upward trend from this year, with USD/JPY dipping below the 50-Day SMA (109.09) for the first time since January.
Nevertheless, USD/JPY appears to have reversed course ahead of the March low (106.37) in an attempt to remove the threat of a head-and shoulders formation, with the exchange rate breaking above the left shoulder in May.
USD/JPY appears to be stuck in a defined range amid the failed attempts to break/close below the 108.00 (23.6% expansion) to 108.40 (100% expansion) region, and the exchange rate may continue to consolidate over the coming days as it appears to be reversing course ahead of the monthly low (108.34).
A move back above the 50-Day SMA (109.09) may push USD/JPY back towards the Fibonacci overlap around 109.40 (50% retracement) to 110.00 (78.6% expansion), but it would need a break/close above the key region to open up the March high (110.97).
Disclosure: See the full disclosure for DailyFX here.


