
USD/JPY At Important Juncture
The recent decline in the USD/JPY pair has taken it to below its long-term uptrend line (starting from the 2012 lows), where it has closed below the line on a weekly basis for the past two weeks. By itself this price behavior is bearish as the rising line represents potential major support given its long-term nature.
- Bearish long-term implications not yet confirmed.
- Potential for 500 plus pip rally if bullish reversal seen in the near-term
- Break below 105.50 likely leads to an acceleration to the downside.
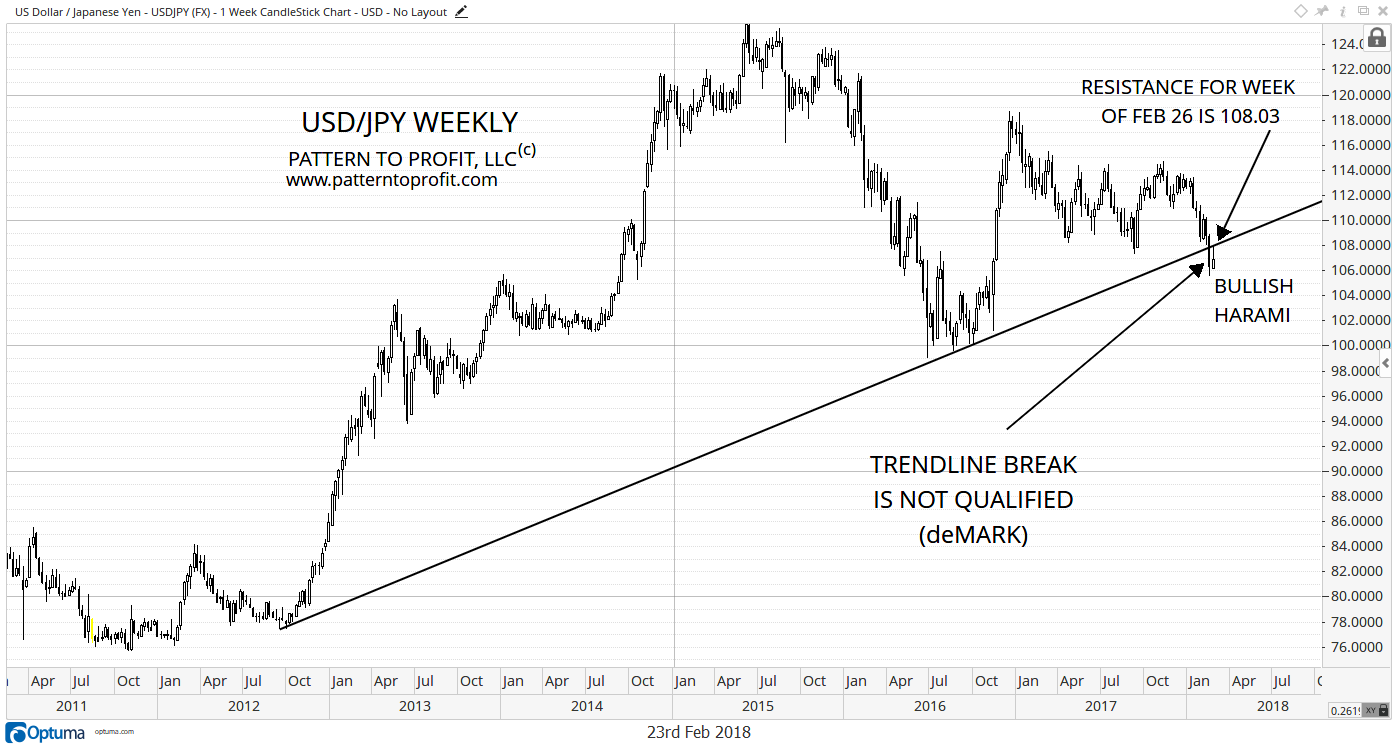
As of the 114.74 low reached two weeks ago the USD/JPY was down as much as 923.7 pips or 8.1% off the last swing high of 114.74 reached in early-November. Regardless of the trend line break it is currently attempting at least an intermediate trend reversal to the upside off the recent lows. If unsuccessful, the next leg of a larger bear market is expected to occur given the bearish implications of the long-term trend line break. Nevertheless, this breakdown does not meet any of the three qualifying conditions of DeMark trend line analysis (New Science of Technical Analysis). Therefore, it is not considered a high probability short entry (although still playable).
For the near-term, as of last week a potential bullish reversal harami candlestick pattern has formed. If the USD/JPY closes this coming week above resistance of 108.03, a full refutation of the line breakdown is made. However, if instead a new low is reached then a successful trend line break is underway, confirming an overall bearish trend continuation.
Next we add analysis of cumulative averages to the charts to see if they add some light to the initial view discussed above. Cumulative averages in the next weekly chart show a bullish upshift in the large correction starting from the high (‘H’), due to more activity above the red resistance average compared to below the blue support average. A support line (black) drawn from points A & B reveal hidden support for the current market.
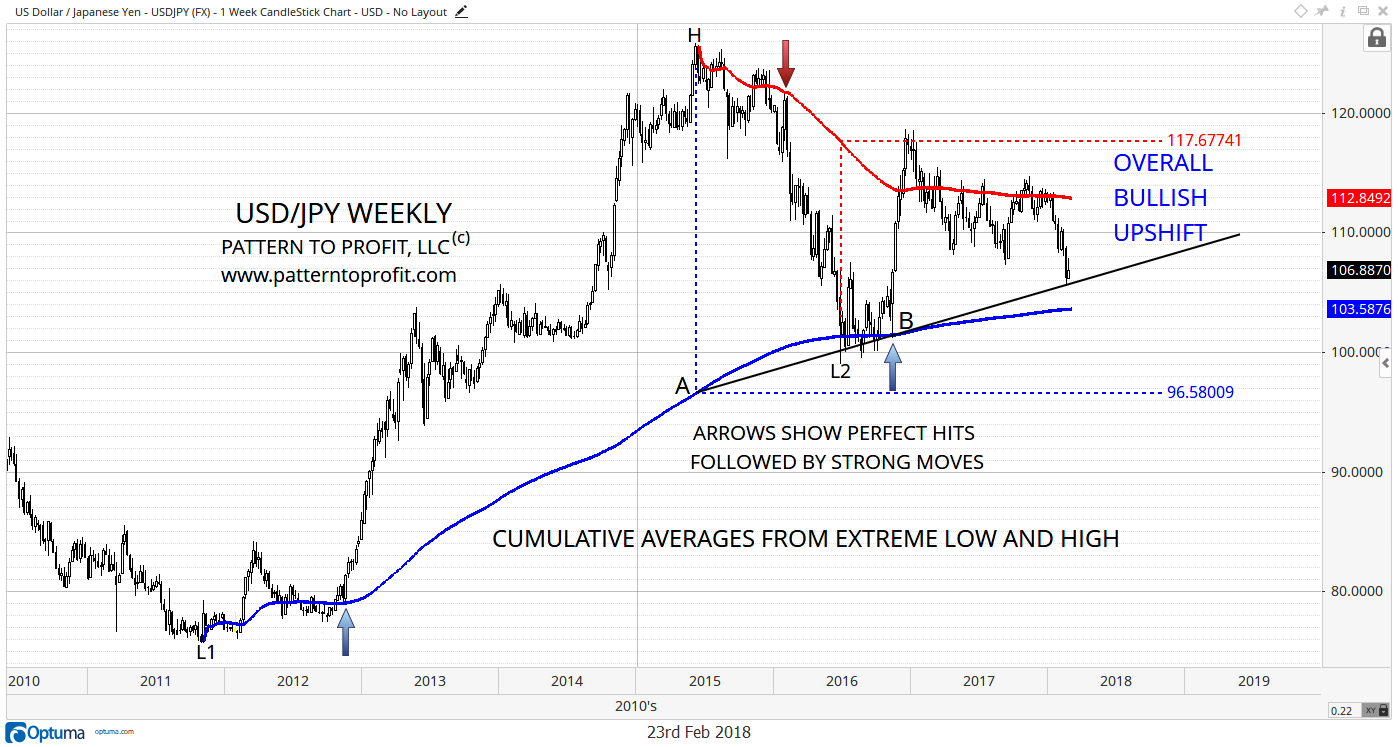
If the USD/JPY breaks below this support line, the next lower support area is expected first around 103.59 (blue average), then at 96.58 (square level of H and blue average). In the case of strength, a successful bounce from the support line should first see resistance around 112.85 (red average), followed by 117.68 (square level of red average with L2).
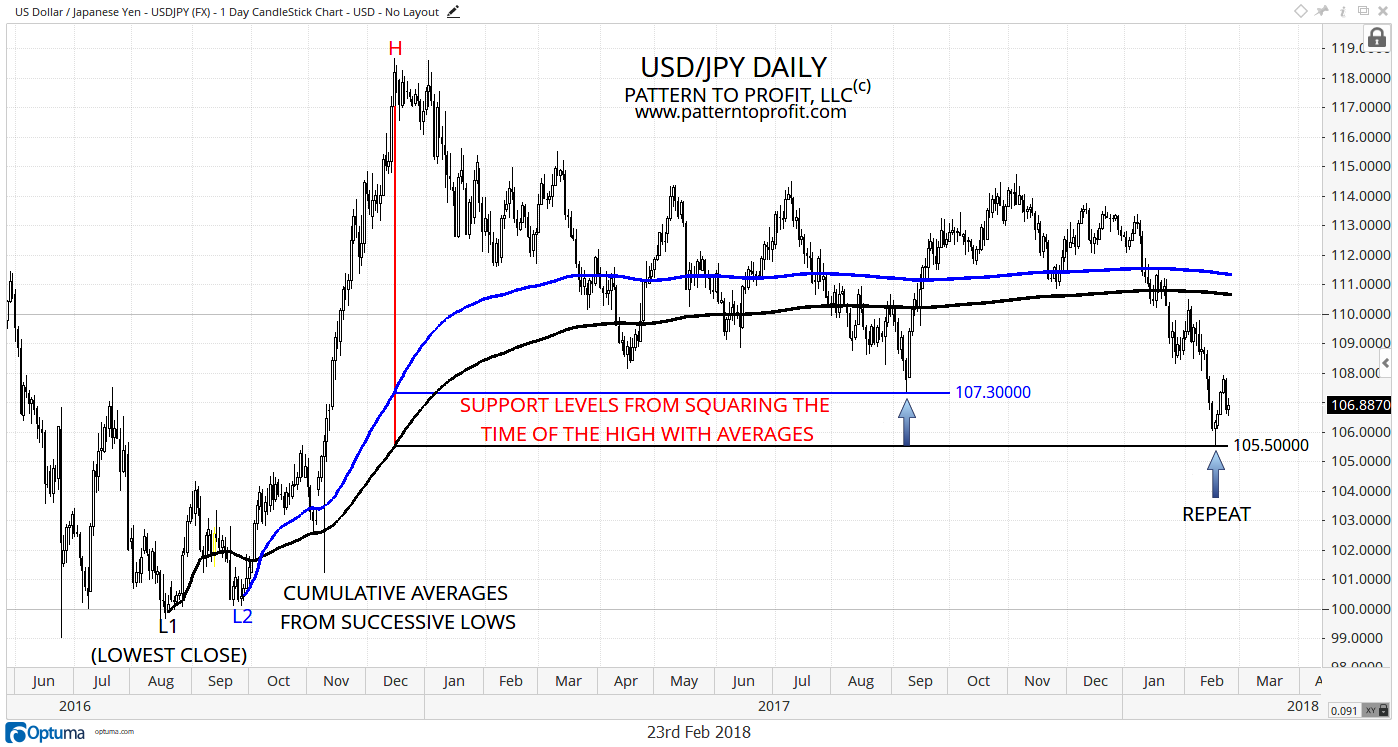
We get a closer view by looking at the next daily chart with and daily cumulative averages from successive lows at L1 (black) & L2 (blue). By squaring the high (red H) with the averages below, the support levels of 107.30 (blue) and 105.50 (black) are provided. The lows at both blue arrows are revealed to be related, indicating a repeated intermediate uptrend.
Disclosure: Pattern to Profit, LLC, any affiliates or employees or third party data provider, shall not have any liability for any loss sustained by anyone who has relied on the information ...
more

