
USD/CAD Weekly Analysis – Sunday, May 19
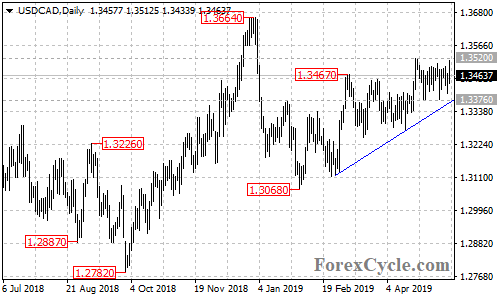
USD/CAD moved sideways in a narrow range between 1.3376 and 1.3520 over the past two weeks. As long as the price is above the rising trend line on the daily chart, the price action in the range could be treated as consolidation for the uptrend from 1.3068.
A breakout of 1.3520 resistance could trigger further upside movement towards 1.3650. Only a clear break below the trend line support could signal completion of the uptrend.
How did you like this article? Let us know so we can better customize your reading experience.

Comments
Leave a comment to automatically be entered into
our contest to win a free Echo Show.

