US Dollar (USD) Outlook: US-China Tensions Likely To Escalate Further
US DOLLAR (DXY) PRICE, CHART AND ANALYSIS
- US President Donald Trump warns China over new Hong Kong security law.
- US Dollar (DXY) breaking support.
US President Trump is threatening China with new economic sanctions as the already fragile relationship between the two superpowers sours further. Already vocal about China’s involvement in the spread of the COVID-19 virus, President Trump is now taking China to task after Beijing tightened its grip on Hong Kong. China this week imposed a new security law on the ex-British colony, undermining the island’s authority and prompting US Secretary of State Mike Pompeo to tell Congress that Hong Kong no longer merits preferential trade status. President Trump is now threatening further measures against China who are likely to respond quickly and in kind. This war of words will be the dominant driver of the US dollar and risk markets in the coming weeks and months.
US data this week continues to point to a protracted economic recovery in America over the coming quarters. While the Fed’s largesse has driven a V-shaped recovery in various US stock markets, the US economy is expected to see a much slower pick-up. This week’s initial jobless claims rose by another 2123k claimants while Q2 GDP q/q turned negative by 5%, its worst reading in over a decade. In addition, US personal spending data, released on Friday, slumped 13.6% month-on-month, the biggest decline on record, as the COVID-19 lockdown kept consumers away from the high street. Data also showed that the US savings rate hit a record 33%, as consumers kept their money in their pockets.
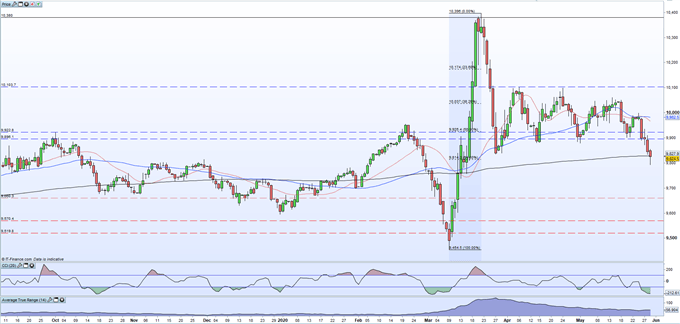
The US dollar basket (DXY) has fallen all week and is back to levels last seen in mid-March. The US dollar is now trading either side of both the 61.8% Fibonacci retracement of the March 9-22 rally and the 200-day moving average. If DXY closes and opens below the 200-dma, further falls are likely. The CCI indicator does show the market as extremely oversold which may temper any further losses in the short-term.
US DOLLAR (DXY) DAILY PRICE CHART (OCTOBER 2019 – MAY 29, 2020)