US Dollar Primed For Weakness - When Will It Break? USD/CAD, GBP/USD
US DOLLAR, USD/CAD, GBP/USD TALKING POINTS:
- The US Dollar has had a busy day being driven by a couple of different themes.
- The net result of this morning’s events has been a pretty clear indication that President Trump wants a weaker US Dollar as the Fed has continued to attempt to strike a tone of stability.
The US Dollar has held resistance through Friday morning’s events, which included an unexpected surprise in the ongoing trade rift between the US and China. This announcement of surprise tariffs from China on US exports came in just hours ahead of FOMC Chair Jerome Powell’s speech at the Jackson Hole Economic Symposium and helped to provide a yo-yo effect to US stocks as an initial move lower on the tariff announcement was quickly offset by a more-dovish-sounding Jerome Powell.
As noted by our own Chris Vecchio earlier this morning, the key statement from Chair Powell appears to be ‘we will act as appropriate to sustain the expansion,’ which points to the fact that the bank is actively watching to see whether the on-off theme of risk aversion comes back, at which point they’ll respond with softer policy.
Chair Powell noted the rising global risks and the ‘deteriorating’ outlook for global growth, both items looked at as dovish factors around the Federal Reserve. Powell did successfully side-step the topic of near-term rate moves while still alluding to the potential for a responsive Central Bank in the face of rising risks, and this has led to a directional move-lower in the US Dollar.
The Greenback came into the day holding on to a resistance zone taken from around April and May highs. This zone was breached briefly in early-August on the heels of the ‘rate cut rally’ in the USD, but since, has come back into play to help hold a series of lower-highs in the currency.
US DOLLAR DAILY PRICE CHART
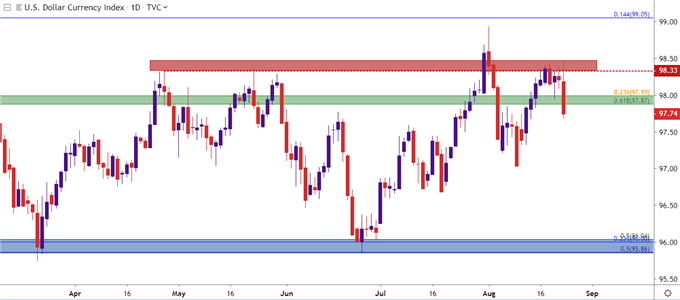
Chart prepared by James Stanley; US Dollar on Tradingview
As looked at Thursday, the longer-term backdrop in the US Dollar is one that appears set for a fall. The currency has traded into a rising wedge formation over the past four months as buyers have remained very responsive near support while getting increasingly less aggressive near new highs or resistance. Such patterns will often point to bearish reversal potential but, given the backdrop, timing that theme can remain incredibly difficult and will likely require a more-concerted dovish flip at the Fed.
The big question for right now is whether this morning’s tightening in tensions on the trade war front and the accompanying dovish response out of the Fed, which remained non-committal, will be enough for sellers to make their push?
US DOLLAR WEEKLY PRICE CHART
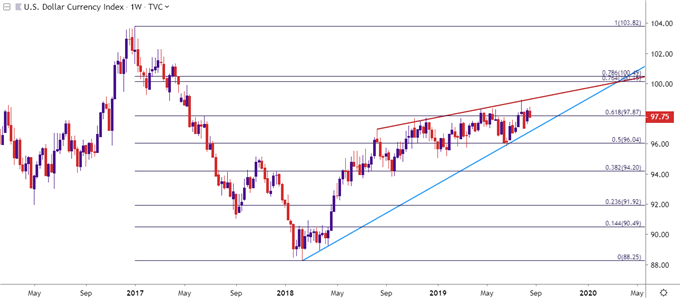
Chart prepared by James Stanley; US Dollar on Tradingview
WHEN WILL THE US DOLLAR BREAK?
Given Friday’s events, the answer to that question has gotten a little more difficult to answer as there’s now a new variable in the equation. Previously, the potential for a September-October breakdown looked probable. The Fed was likely going to try to remain stable and consistent, looking to avoid ringing alarm bells with a 50 basis point cut.
But – with the trade war ramping up yet again, stress could continue in the near-term until the Fed does begin to show a bit more concern. Case in point – the US Dollar is now trading at a fresh weekly low and that scenario could continue well-ahead of the next FOMC rate decision less than a month away.
US DOLLAR FOUR-HOUR PRICE CHART
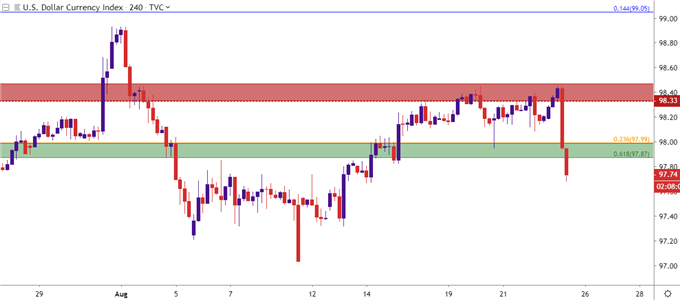
Chart prepared by James Stanley; US Dollar on Tradingview
US DOLLAR WEAKNESS STRATEGIES
So, at this point it should be pretty clear that the President of the United States wants a weaker US Dollar. And while POTUS may have a minimal impact on monetary policy, he does have the reins of fiscal policy, which could arguably be even more impactful long-term. The Fed seems to be hesitant to just give in to the demands for softer policy yet as employment has remained strong and inflation near the bank’s 2% target. And at this point, while markets are amped up for more softening out of the Fed later this year, the bank simply hasn’t acknowledged that directly, instead hinting that they could post cuts if needed by not appearing yet ready to commit.
This begs the question of positioning around themes of USD-weakness, and as looked at over the past couple of months, Gold will likely remain as one of the more attractive venues for such themes. Given this morning’s continued bullish breakout, that theme remains intact.
But outside of Gold, there may be a few areas of focus for currency traders, specifically looking at the Canadian Dollar and the British Pound.
USD/CAD READY TO REVERSE?
The month of June provides a template here as that outlay saw both a strong Canadian Dollar to go along with a weak US Dollar as the Fed was talking up softer policy. This led to a precipitous decline below a trend-line that had held the lows for much of the prior year. That bearish theme took a break for about a month, from mid-July into mid-August as both of those drivers saw a bit of respite. June inflation numbers came in soft out of Canada and the Federal Reserve tried to walk a line of stability on the monetary policy front.
But – Wednesday brought another surprisingly strong Canadian inflation print and that goes along with this recent addition of USD-weakness. USD/CAD may soon be ready to get back to its bearish ways. The pair has already shown tendencies of topping by holding inside of resistance over the past two weeks. But, at this stage, bulls haven’t yet given up, and a breach of the bullish trend-line can re-open the door for short-side strategies in the pair.
USD/CAD DAILY PRICE CHART
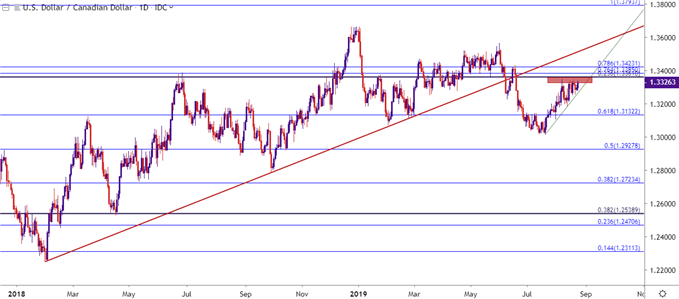
Chart prepared by James Stanley; USDCAD on Tradingview
GBP/USD
I’ll be the first to admit that given the fundamental backdrop here, bullish setups in Cable can be a bit difficult to justify. The UK is heading head-first into Brexit and we still have no clue how the divorce will take place, or even if it will take place at all. What we do know, however, is that the pair has struggled to continue its descent since a long-term trend-line came into play earlier this month. Below, on the monthly GBP/USD chart, emphasis is paid to a trendline connecting the 1985 pre-Plaza Accord lows with the flash crash from 2016. So far, this has helped to hold the pair after a dizzying sell-off continued from April and into August.
GBP/USD MONTHLY PRICE CHART
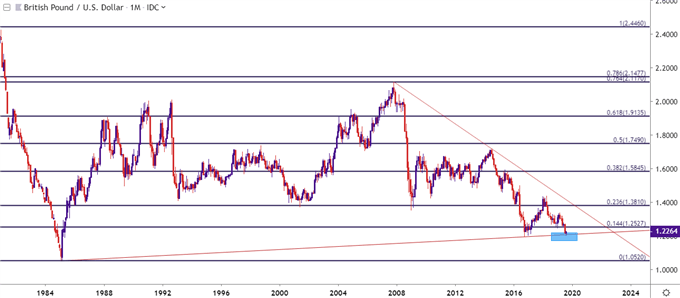
Chart prepared by James Stanley; GBPUSD on Tradingview
The allure around potential topside in GBP/USD at the moment is two-fold, based largely on the technical backdrop and a bit of contrarianism. With Boris Johnson taking a rather rigid stance into discussions, where he refuses to take the option of No-Deal Brexit off-the-table, he’s shown that he’s been able to get a bit of cooperation from the European side on the Irish backstop. And in the British currency itself, that four-month-trend of pain saw the pair move into deep oversold levels that have yet to fully abate; meaning there could be a considerable number of short positions still left to cover, particularly should USD-weakness take over as a dominant theme in the coming weeks.
GBP/USD FOUR-HOUR PRICE CHART
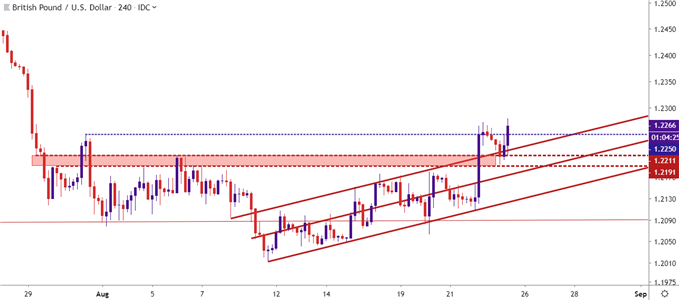
Chart prepared by James Stanley; GBPUSD on Tradingview


