
US Dollar Price Action Setups: EUR/USD, GBP/USD, USD/JPY, USD/CAD
US Dollar Talking Points
- The US dollar has thus far spent October digesting the bullish move that showed with prominence in late September.
- This week sees the focus shift to a key inflation report out of the US with the release of CPI on Wednesday. With the Fed’s potential tapering announcement around the corner at the November FOMC, the focus on this data release will likely be intense for risk trends.
The US dollar is continuing to digest the September breakout, with price action now forming a symmetrical triangle over the first eleven days of October trade. The US dollar broke out to a fresh yearly high before the end of Q3, eventually finding resistance at the 38.2% Fibonacci retracement of last year’s sell-off, plotted at 94.47.
That led to a pullback in early-October trade as prices pushed down to find support at prior resistance, taken from the 93.73 swing-high that had set in August. But that bounce was unable to take out Fibonacci resistance and price has since continued to coil, setting the stage for breakout potential with that CPI print now a little under 48 hours away.
US Dollar Four-Hour Price Chart
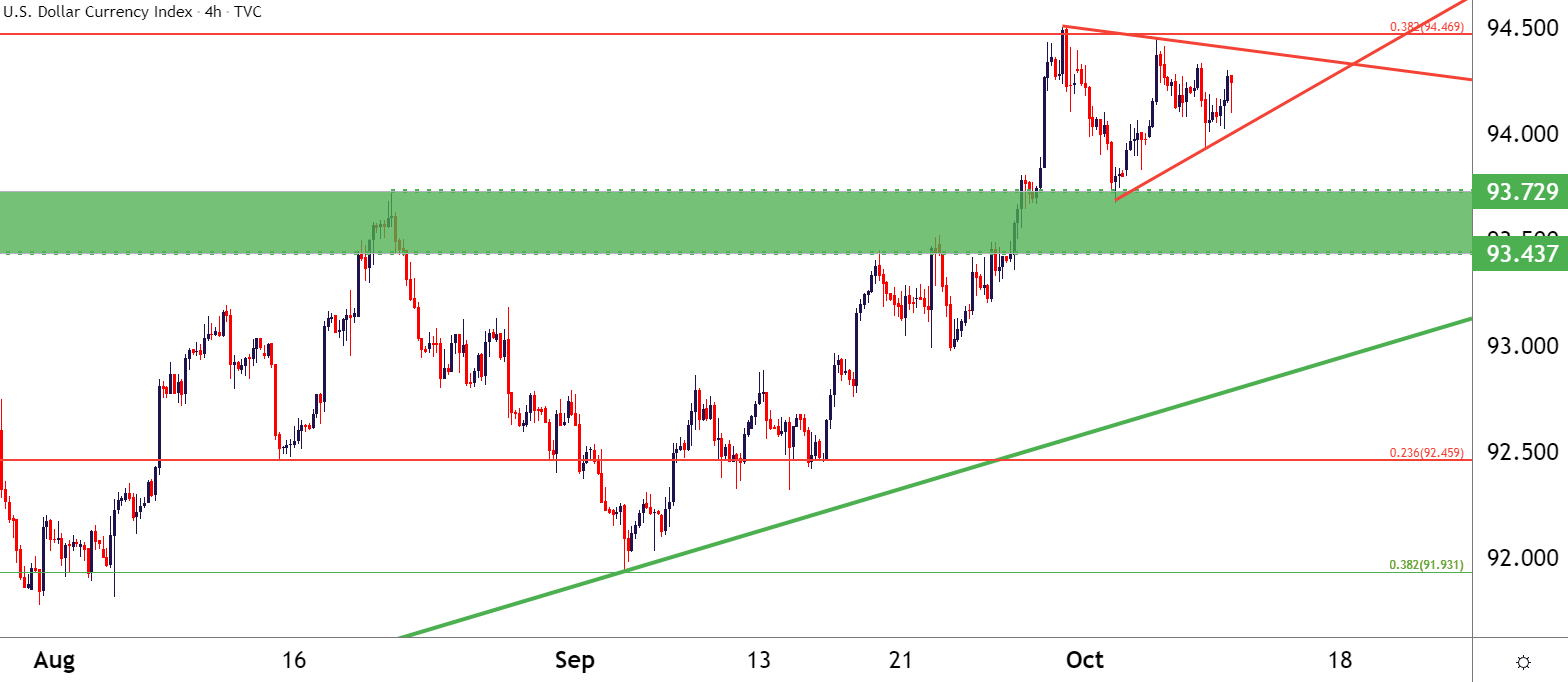
Chart prepared by James Stanley; USD, DXY on Tradingview
US Dollar Longer-Term
For the Q4 technical forecast I initiated a bullish bias on the US dollar, owed in large part to a breakout formation that built over the past four months. The USD had set an ascending triangle formation with horizontal resistance combined with higher-low support.
Bulls began to break the horizontal resistance in late-September, and with the shorter-term symmetrical triangle appearing, combined with the prior bullish trend as part of that breakout, and there’s another formation at work: The bull pennant.
The bull pennant formation is often approached with the aim of trend continuation, hypothesizing that the recent breakout needs to rest as the fresh higher-highs have difficulty eliciting fresh buyers. But, if the force that caused the breakout in the first place can remain, there’ll often be a show of buyer support at higher-lows.
And with inflation on the docket for Wednesday, that potential is there for bullish continuation scenarios in the US dollar with the current formation matching that backdrop.
US Dollar Daily Price Chart
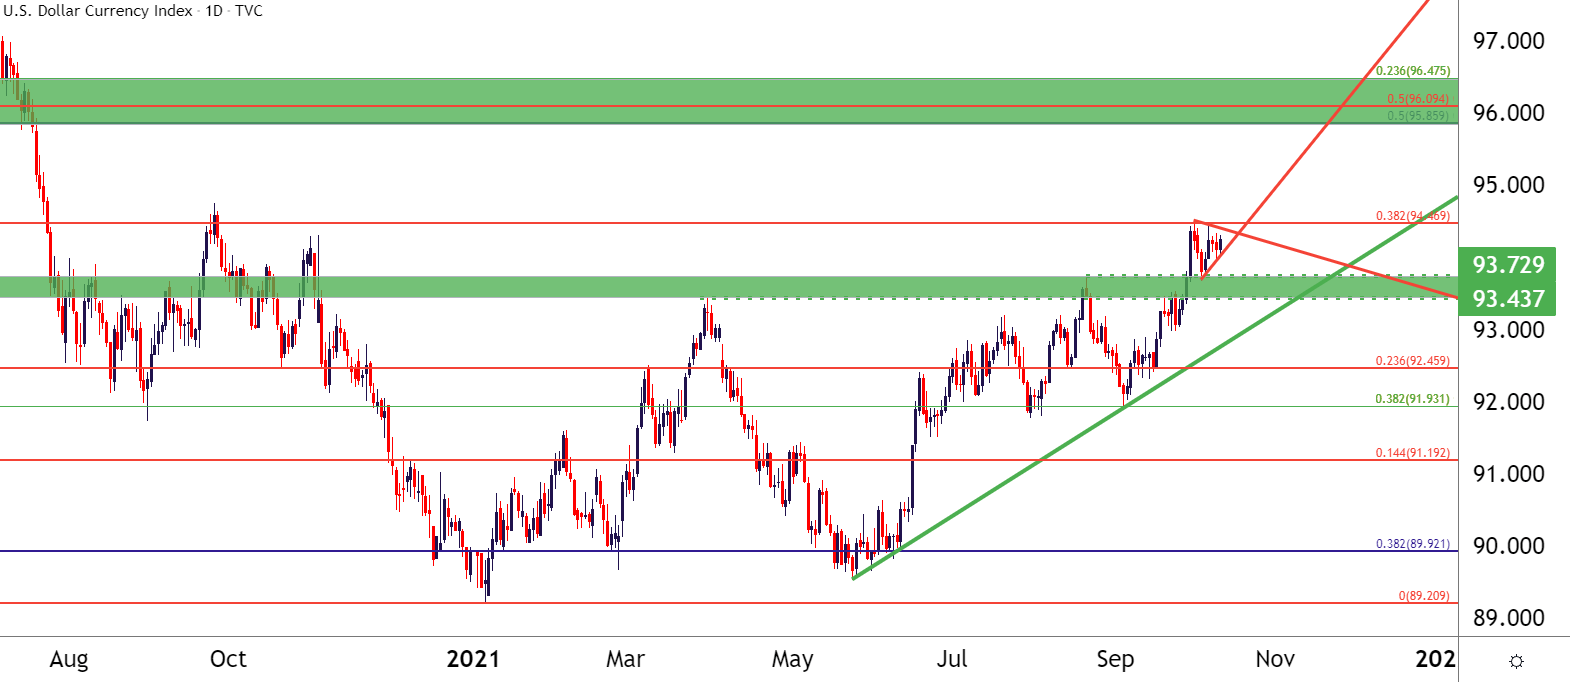
Chart prepared by James Stanley; USD, DXY on Tradingview
EUR/USD: Short-Term Bear Flag
On a longer-term basis, there’s not a lot of excitement in EUR/USD at the moment. The pair saw another bearish extension of the trend last week, but sellers slowed shortly after the establishment of a fresh low. The corresponding pullback hasn’t exactly been aggressive, with the bullish move off of last Wednesday’s lows capping out at around 60 pips.
The shorter-term setup may be a bit more exciting here, especially with inflation numbers due on Wednesday. The US reports at 830 a.m. on Wednesday but German inflation data is released ahead of that, keeping the euro in the spotlight around those data points.
For the short-term, EUR/USD built into a bear flag formation, accented with a bullish channel at the bottom of a bearish trend. This keeps the door open for bearish continuation scenarios and for short-term resistance, the prior spot of support, taken from levels around 1.1600 and 1.1664 to remain of interest.
If neither of those levels can hold the high and if a broader pullback begins to show, the prior support zone at 1.1709-1.1736 would be yet to see resistance after the late-September breach of this key zone.
EUR/USD Two-Hour Price Chart
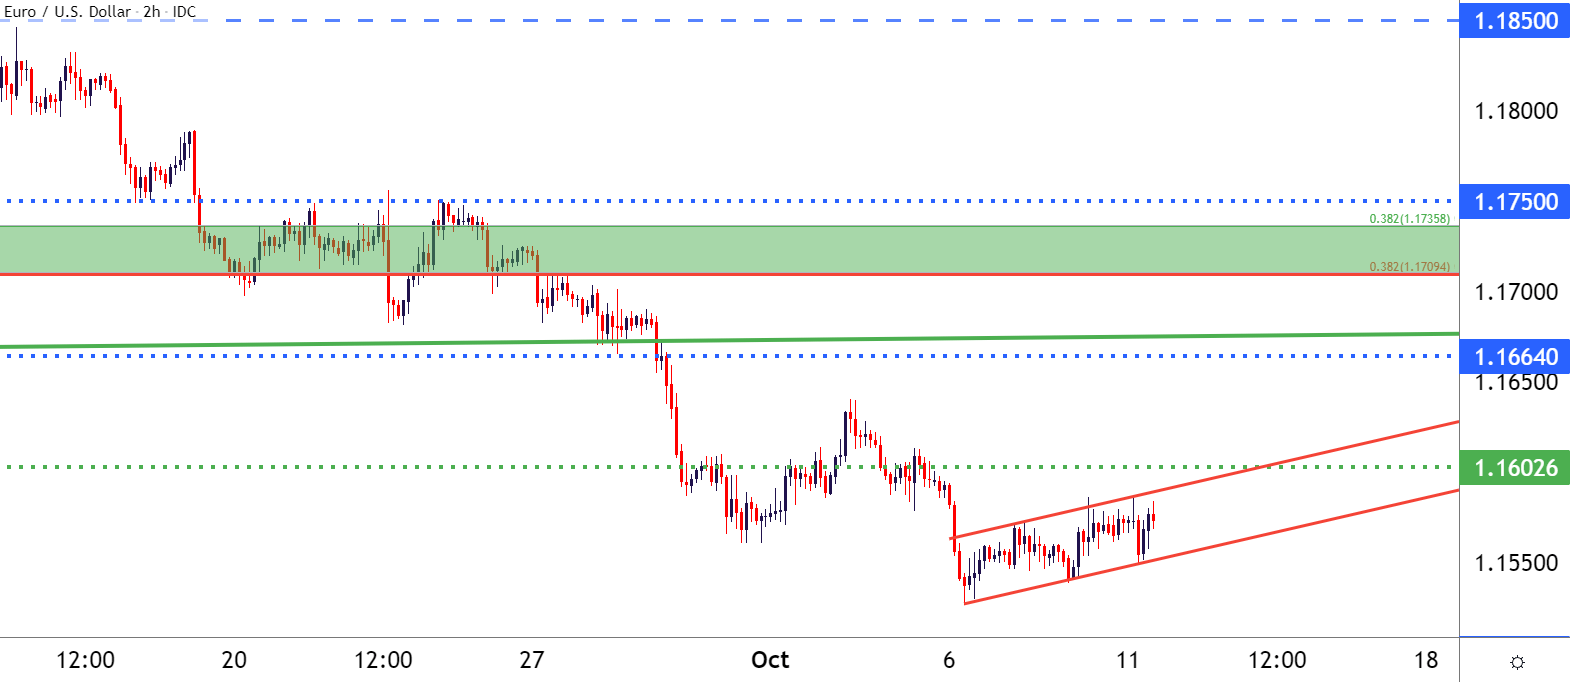
Chart prepared by James Stanley; EURUSD on Tradingview
GBP/USD Snap Back for Resistance Test
Last week saw the GBP/USD pair react at the underside of a key resistance zone comprised of two different Fibonacci levels, spanning from 1.3649-1.3678. There was a reaction that totaled about 100 pips in that move, but sellers were unable to break much fresh ground below 1.3550. That’s led to a bounce back into this resistance zone but this time, buyers were able to nudge up towards the top side of the area around 1.3678, which has since held.
From the daily chart, this keeps the door open for short-side swings. But, shorter-term, there’s a similar build of higher-lows with that horizontal resistance, which produces an ascending triangle that can be followed for short-term bullish breakout scenarios.
Given the rates dynamic, with the UK possibly nearing a rate hike in the effort of stemming inflation, any bouts of USD-weakness could play nicely for topside here in GBP/USD, particularly if Wednesday’s inflation data comes out below expectations.
GBP/USD Four-Hour Price Chart
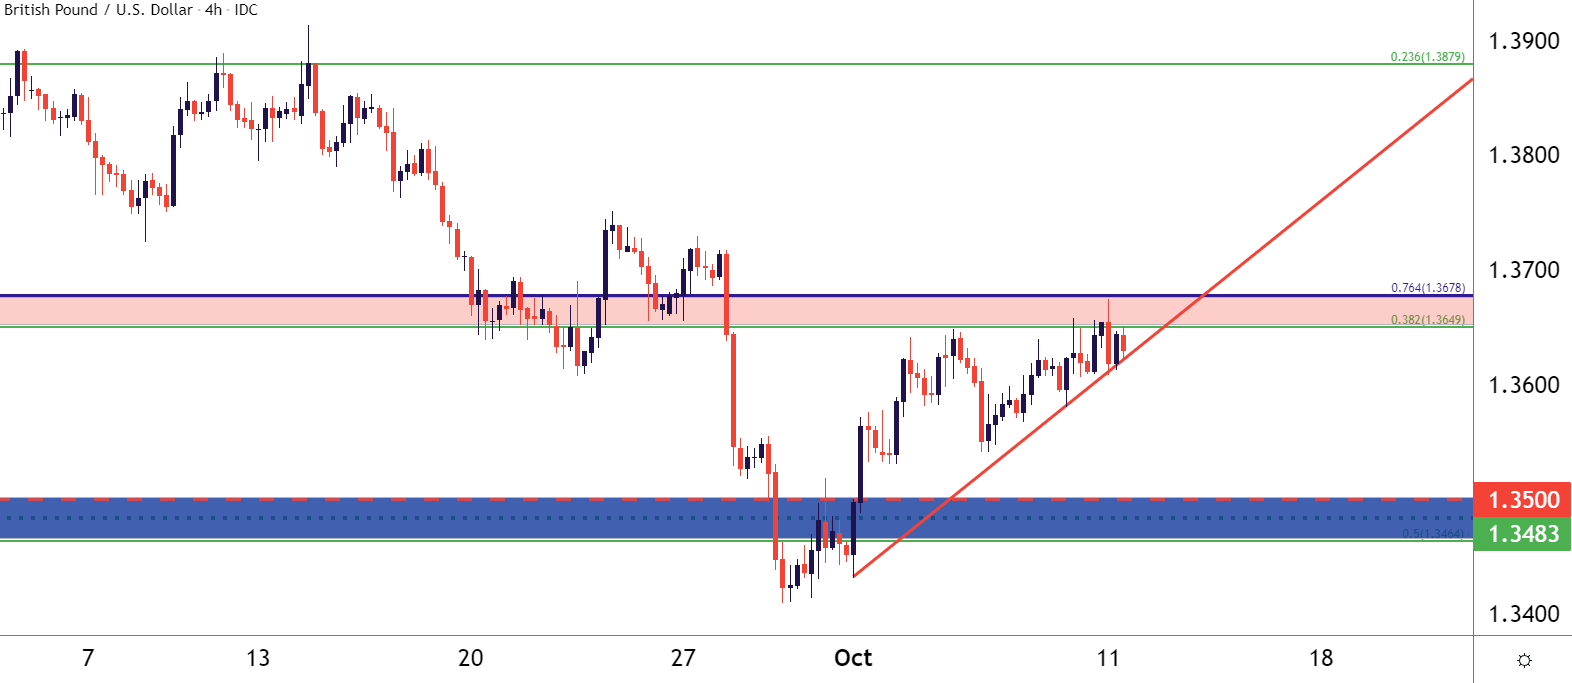
Chart prepared by James Stanley; GBPUSD on Tradingview
USD/JPY: Big Breakout to Near Three-Year Highs
I’ve been talking about this pair much more than usual since the FOMC’s September rate decision. When the bank warned of possibly faster rate hikes, much of the attention turned to the US dollar. But JPY may have an even more aggressive case for focus from FX traders because of the deductive rate dynamic that will and has begun to play out.
The first quarter of this year can be used as a proxy: As US rates were flying higher in anticipation of recovery and hope produced by vaccines, US rates jumped and this drove USD strength in many FX pairs. That strength was on full display in USD/JPY because not only was the USD well-bid on the back of higher rate themes, but JPY was very bearish as the currency could then be used with carry trades again.
With a Bank of Japan that’s been sitting on negative rates since 2016, there’s little hope of change anytime soon, so in a dynamic like USD/JPY, where one currency is bid on the back of higher rates, the low-rate Japanese yen could be an attractive counterparty to allow for explosive moves.
That’s continued in USD/JPY, and a number of other pairs as yen weakness tracks along with higher US rates. This was the rationale for setting GBP/JPY as my ‘top trade for Q4,’ looking to harness both higher rate expectations out of the UK to go along with this premise for JPY weakness.
USD/JPY crossed a big marker today, jumping up to a near three-year high. The zone of prior resistance had held the highs in 2019, 2020 and, until this morning, 2021. It runs from a long-term Fibonacci level at 111.61 up to the psychological level of 112.50. With prices in the pair so overbought at the moment, awaiting a pullback to support at this prior spot of resistance seems to be a more prudent way of moving forward.
USD/JPY Weekly Price Chart
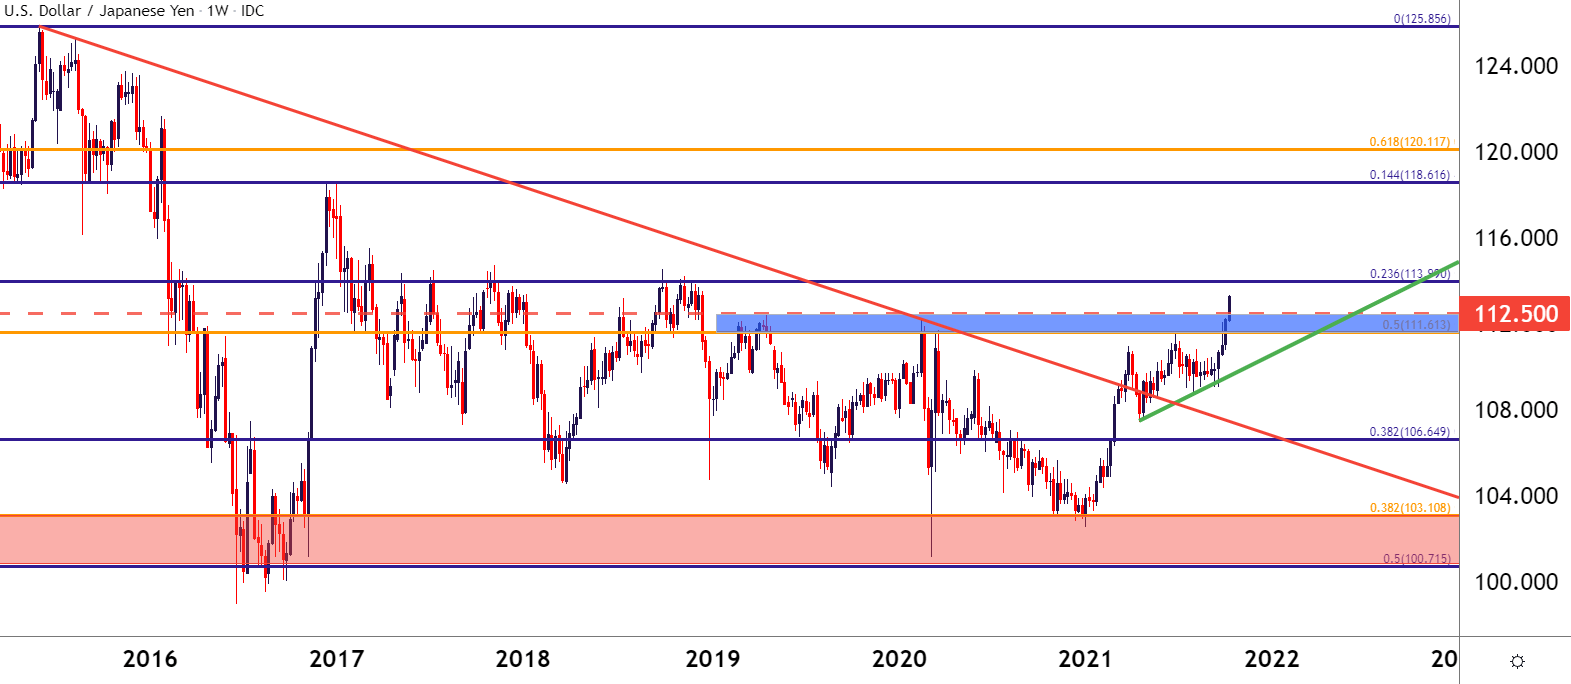
Chart prepared by James Stanley; USDJPY on Tradingview
USD/CAD Sinks Through Support as Oil Surges Past 80
On the short side of the US dollar, USD/CAD has started to look more an more attractive. The Canadian dollar has remained fairly heavy in the pair recently. Notably, as the US dollar was jumping to fresh highs against most other currencies over the past couple of weeks, USD/CAD was pinned down to support last week, eventually falling through the 1.2621 spot.
That breakdown theme hastened on Thursday and Friday as price action fell through the bottom of a symmetrical triangle and breaking below the 1.2500 psychological level. This can keep USD/CAD as one of the more attractive short-USD candidates.
Potential lower-high resistance exists at the 1.2500 psychological level and a little higher, around 1.2546, which was the prior swing-low just before last week’s breakdown.
USD/CAD Daily Price Chart
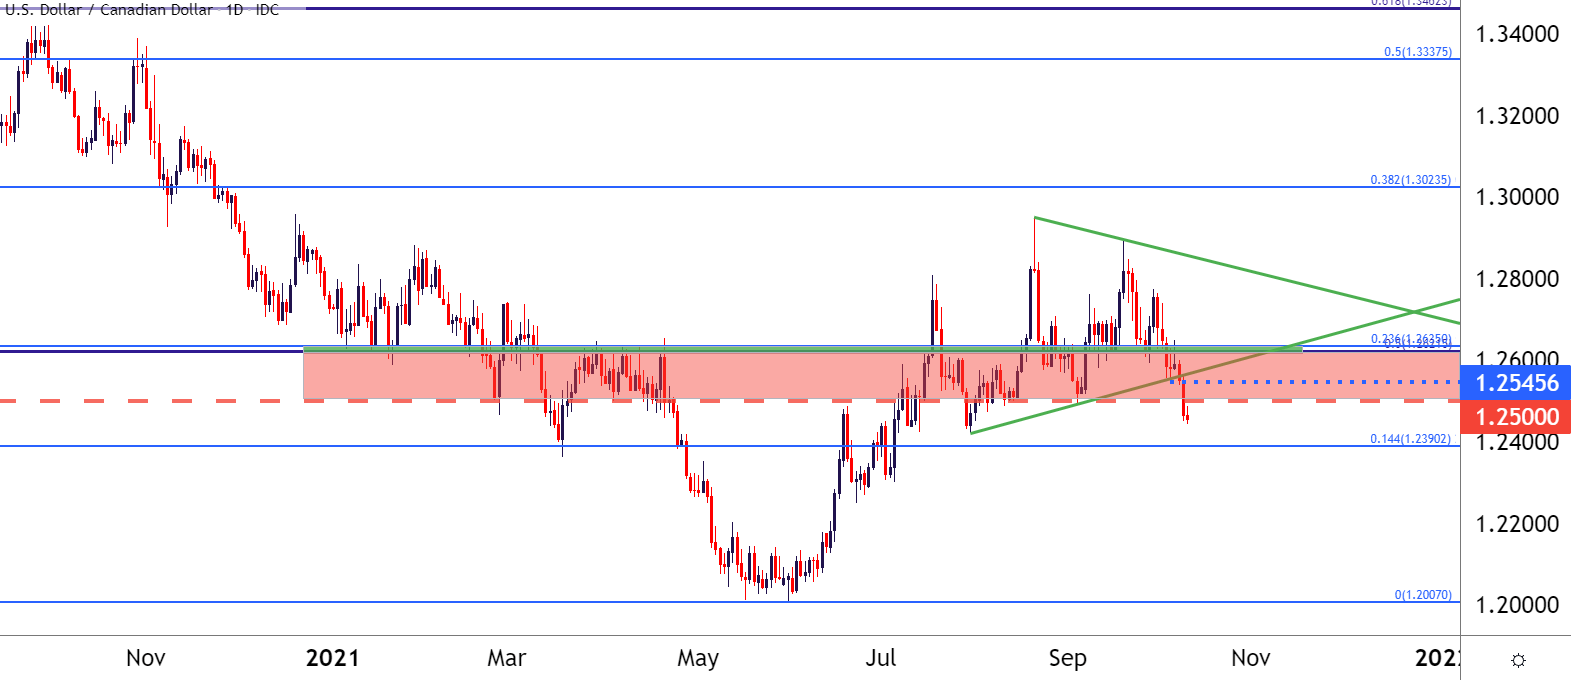
Chart prepared by James Stanley; USDCAD on Tradingview
The analysis contained in article relies on price action and more


