
Trading Support And Resistance - Sunday, July 5
This week we’ll begin with our monthly and weekly forecasts of the currency pairs worth watching. The first part of our forecast is based upon our research of the past 16 years of Forex prices, which shows that the following methodologies have all produced profitable results:
- Trading the two currencies that are trending the most strongly over the past 3 months.
- Assuming that trends are usually ready to reverse after 12 months.
- Trading against very strong counter-trend movements by currency pairs made during the previous week.
- Buying currencies with high-interest rates and selling currencies with low-interest rates.
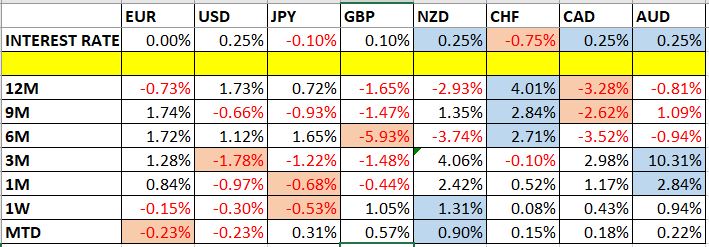
Let’s look at the relevant data of currency price changes and interest rates to date, which we compiled using a trade-weighted index of the major global currencies:
Monthly Forecast July 2020
For the month of July, we make no forecast.
For the month of June, we forecast that the best trade would be long EUR/USD. The performance was positive, as shown in the table below:

Weekly Forecast July 5
Last week, we made no forecasts as there were no strong counter-trend movements sharply against any dominant trends over the past week.
This week, we again make no forecast.
The Forex market showed an increase in volatility compared to the previous week, with one-third of the important currency pairs and crosses moving by more than 1% in value last week. Volatility is likely to remain over the coming week.
Last week was dominated by relative strength in New Zealand and relative weakness in the Japanese Yen.
Key Support/Resistance Levels for Popular Pairs
We teach that trades should be entered and exited at or very close to key support and resistance levels. There are certain key support and resistance levels that can be watched on the more popular currency pairs this week.
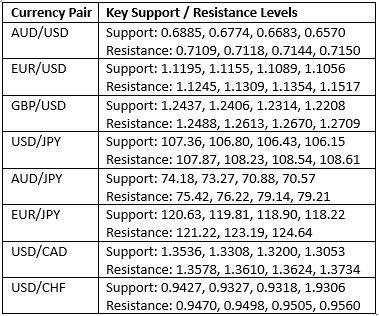
Let’s see how trading one of these key pairs last week off key support and resistance levels could have worked out:
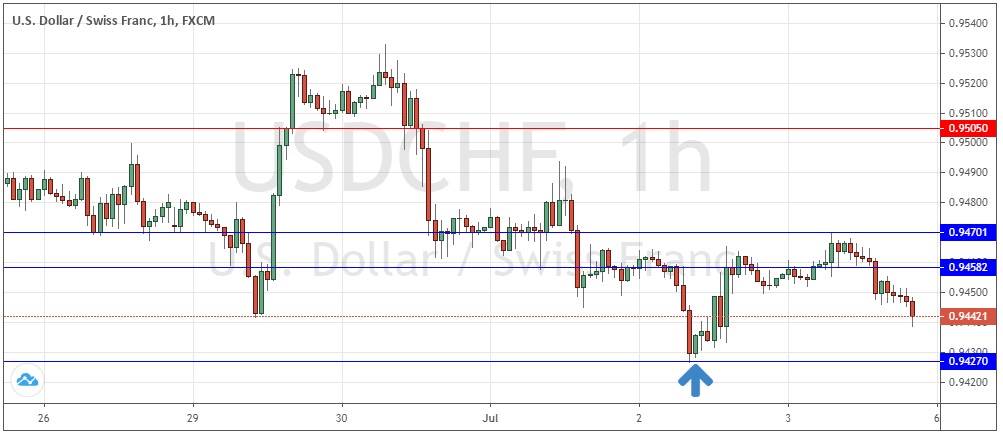
USD/CHF
We had expected the level at 0.9427 might act as support, as it had acted previously as both support and resistance. Note how these “flipping” levels can work well. The H1 chart below shows how the price rejected this level near the start of last Thursday’s London session, typically a great time to be trading major currency pairs, turning decisively bullish with a bullish inside candlestick breaking up right away at the up arrow shown in the price chart below. This trade has been profitable, achieving a maximum positive reward to risk ratio of almost 3 to 1 so far based upon the size of the entry candlestick structure.
Disclaimer: DailyForex will not be held liable for any loss or damage resulting from reliance on the information contained within this website including market news, analysis, trading signals and ...
more

