
Trading Support And Resistance - Sunday, February 23
This week we’ll begin with our monthly and weekly forecasts of the currency pairs worth watching. The first part of our forecast is based upon our research of the past 16 years of Forex prices, which show that the following methodologies have all produced profitable results:
- Trading the two currencies that are trending the most strongly over the past 3 months.
- Assuming that trends are usually ready to reverse after 12 months.
- Trading against very strong counter-trend movements by currency pairs made during the previous week.
- Buying currencies with high interest rates and selling currencies with low interest rates.
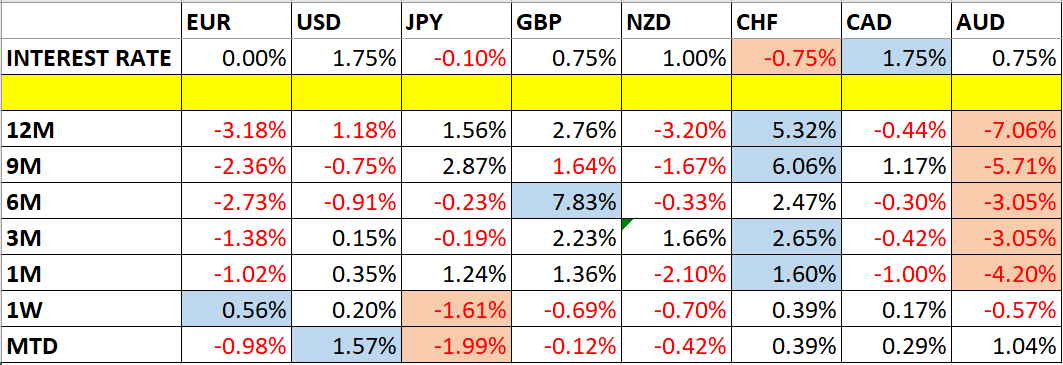
Let’s look at the relevant data of currency price changes and interest rates to date, which we compiled using a trade-weighted index of the major global currencies:
Monthly Forecast February 2020
For the month of February, we forecast that the best trade would be short AUD/JPY. The performance to date is as follows:

Weekly Forecast February 23
Last week, we made no weekly forecast. As there were again no large counter-trend price movements, we again make no forecast this week.
The Forex market is showing slightly less price activity compared to last week, with 33% of the important currency pairs and crosses moving by more than 1% in value over the past week. Volatility is likely to remain at a similar level over the coming week.
Last week was dominated by relative strength in the Euro, and relative weakness in the Japanese Yen.
Previous Monthly Forecasts
You can view the results of our previous monthly forecasts here.
Key Support/Resistance Levels for Popular Pairs
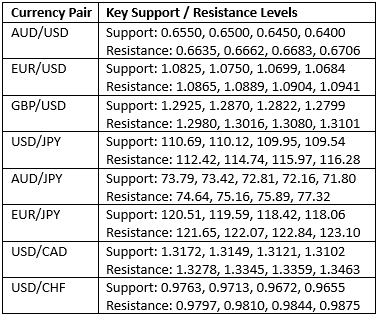
We teach that trades should be entered and exited at or very close to key support and resistance levels. There are certain key support and resistance levels that should be watched on the more popular currency pairs this week, which might result in either reversals or breakouts:
Let’s see how trading one of these key pairs last week off key support and resistance levels could have worked out:
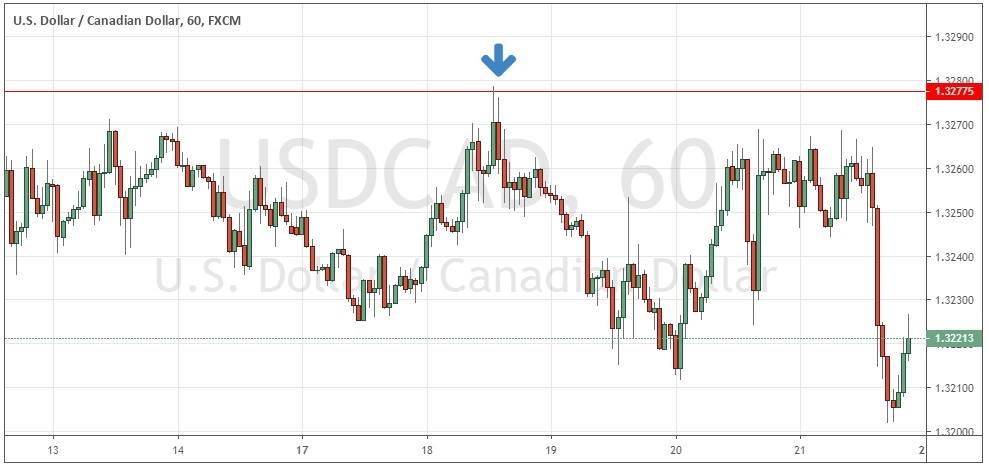
USD/CAD
We had expected the level at 1.3278 might act as resistance, as it had acted previously as both support and resistance. Note how these “flipping” levels can work very well. The H1 chart below shows how near the beginning of last Tuesday’s New York session, the price bounced strongly off that level, forming a bearish combined candlestick “V” formation marked by the down arrow in the price chart below, which immediately broke to the downside. This trade has given a maximum reward to risk ratio so far of a little more than 2 to 1.
Disclosure: DailyForex will not be held liable for any loss or damage resulting from reliance on the information contained within this website including market news, analysis, trading signals ...
more

