Trading Support And Resistance - Sunday, December 29
This week we’ll begin with our monthly and weekly forecasts of the currency pairs worth watching. The first part of our forecast is based upon our research of the past 16 years of Forex prices, which show that the following methodologies have all produced profitable results:
- Trading the two currencies that are trending the most strongly over the past 3 months.
- Assuming that trends are usually ready to reverse after 12 months.
- Trading against very strong counter-trend movements by currency pairs made during the previous week.
- Buying currencies with high interest rates and selling currencies with low interest rates.
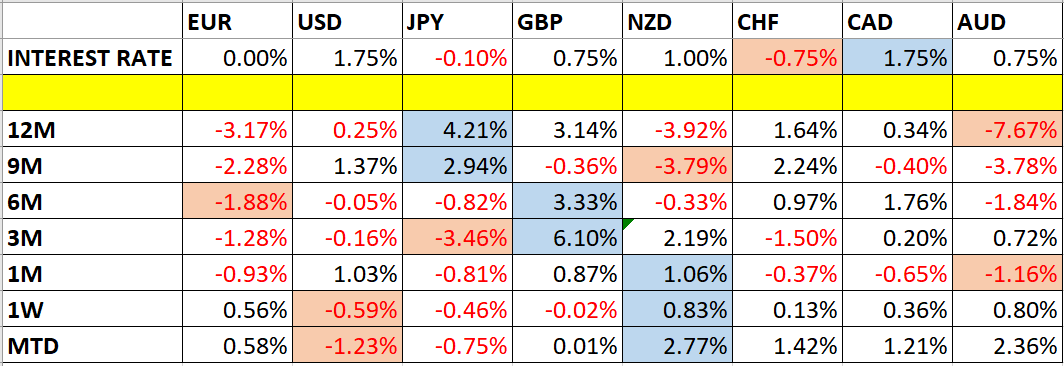
Let’s look at the relevant data of currency price changes and interest rates to date, which we compiled using a trade-weighted index of the major global currencies:
Monthly Forecast January 2020 / December 2019
For the month of January, we forecast that the best trades will be long EUR/USD and long NZD/USD.
For the month of December, we forecast that the best trade would be long USD/JPY. The performance to date is as follows:

Weekly Forecast December 29
Last week, we forecast that the EUR/GBP currency cross would fall in value, but in fact it rose by 0.29%. We make no weekly forecast this week, as there were no strong counter-trend movements last week.
The Forex market has shown decreased activity, with only 19% of the important currency pairs and crosses moving by more than 1% in value over the past week. Volatility is likely to be higher over the coming week.
Last week was dominated by relative strength in the New Zealand Dollar, and relative weakness in the U.S. Dollar.
Previous Monthly Forecasts
You can view the results of our previous monthly forecasts here.
Key Support/Resistance Levels for Popular Pairs
We teach that trades should be entered and exited at or very close to key support and resistance levels. There are certain key support and resistance levels that should be watched on the more popular currency pairs this week, which might result in either reversals or breakouts:
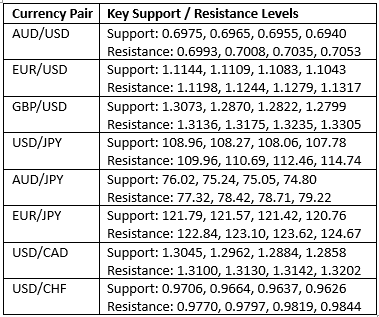
Let’s see how trading one of these key pairs last week off key support and resistance levels could have worked out:
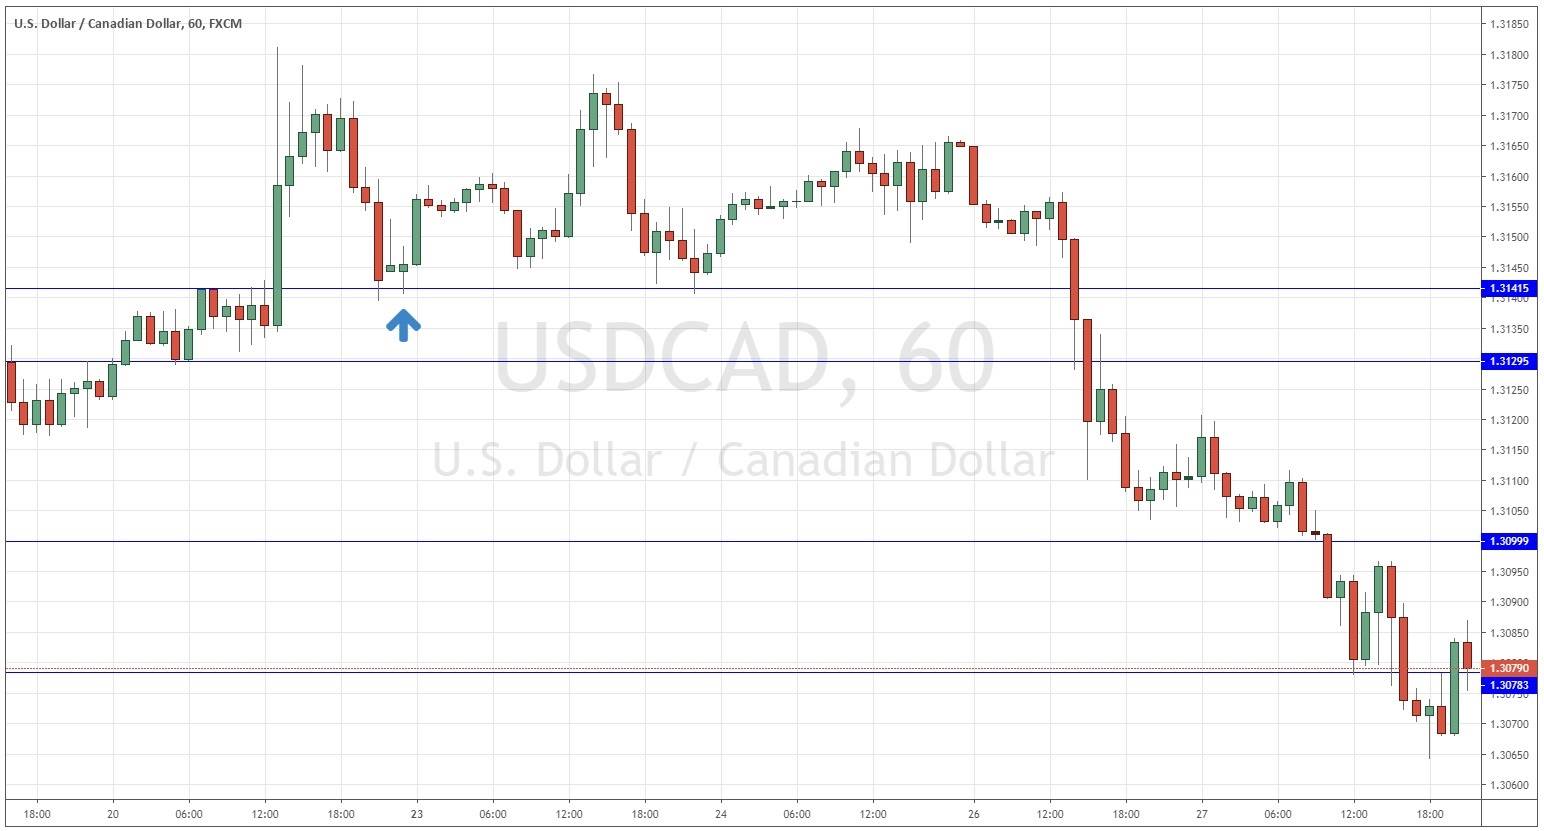
USD/CAD
We had expected the level at 1.3142 might act as support, as it had acted previously as both support and resistance. Note how these “flipping” levels can work very well. The H1 chart below shows how just after the week had opened for trading in Asia, the price bounced strongly off that level, forming a small bullish doji candlestick marked by the up arrow in the price chart below, which immediately broke to the upside. This trade had a relatively tight stop loss, which increased its profitability even though it never went very far into profit. This trade gave a maximum reward to risk ratio of just a little more than 2 to 1.