Trading Support And Resistance - Sunday, December 1
This week we’ll begin with our monthly and weekly forecasts of the currency pairs worth watching. The first part of our forecast is based upon our research of the past 16 years of Forex prices, which show that the following methodologies have all produced profitable results:
- Trading the two currencies that are trending the most strongly over the past 3 months.
- Assuming that trends are usually ready to reverse after 12 months.
- Trading against very strong counter-trend movements by currency pairs made during the previous week.
- Buying currencies with high interest rates and selling currencies with low interest rates.
Let’s look at the relevant data of currency price changes and interest rates to date, which we compiled using a trade-weighted index of the major global currencies:
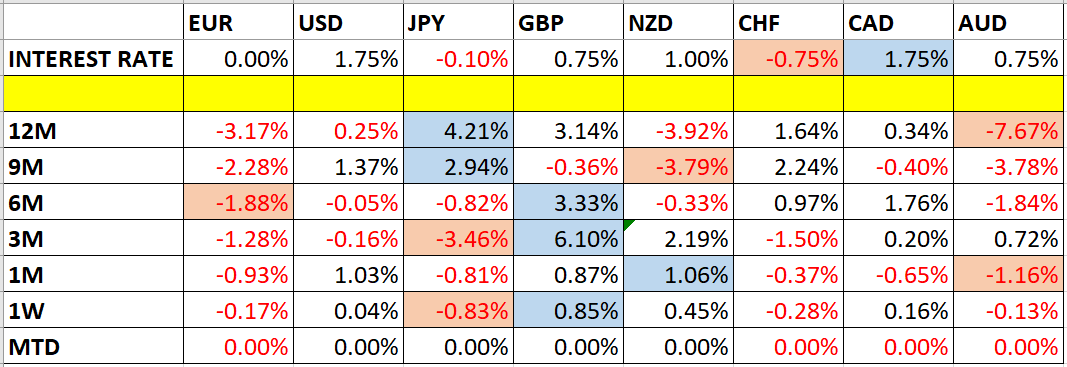
Monthly Forecast December 2019
For the month of December, we forecast that the best trade will be long USD/JPY.
Weekly Forecast December 1
Last week, we made no weekly forecast as there were no very strong countertrend movements. This week we again make no forecast.
The Forex market has become a little more active, with only 14% of the important currency pairs and crosses moving by more than 1% in value over the past week. Volatility is likely to be considerably higher over the next week.
Last week was dominated by relative strength in the British Pound, and relative weakness in the Japanese Yen.
Previous Monthly Forecasts
You can view the results of our previous monthly forecasts here.
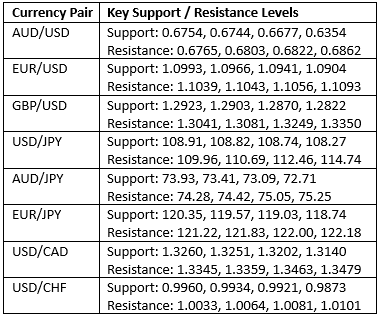
Key Support/Resistance Levels for Popular Pairs
We teach that trades should be entered and exited at or very close to key support and resistance levels. There are certain key support and resistance levels that should be watched on the more popular currency pairs this week, which might result in either reversals or breakouts:
Let’s see how trading two of these key pairs last week off key support and resistance levels could have worked out:
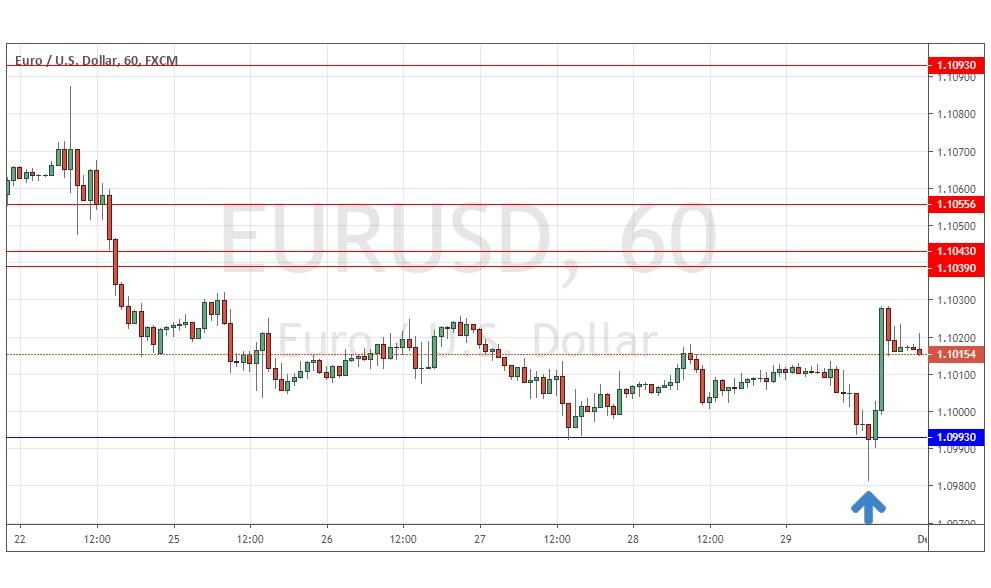
EUR/USD
We had expected the level at 1.0993 might act as support, as it had acted previously as both support and resistance. Note how these “flipping” levels can work very well. The H1 chart below shows how just after last Friday’s New York open, the price bounced strongly off that level for the second time during the week, forming a large bullish pin candlestick marked by the up arrow in the price chart below, which immediately broke to the upside. Note how the beginning of a major session such as the New York session can often be a great time to enter trades in major currency pairs which involve the U.S. Dollar. This trade has given an acceptable maximum reward to risk ratio of just slightly less than 2 to 1 so far.
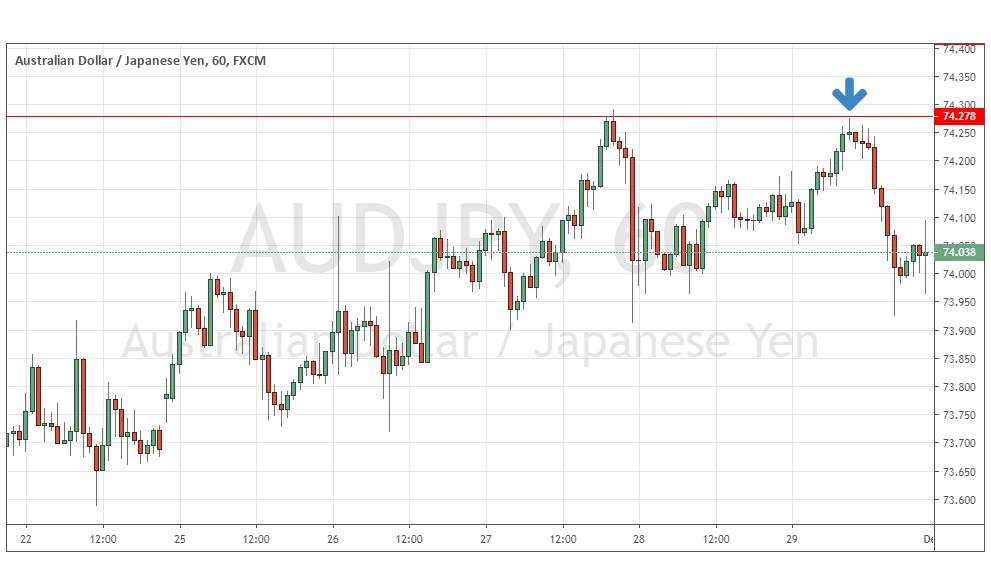
AUD/JPY
We had expected the level at 74.28 might act as resistance, as it had acted previously as both support and resistance. Note how these “flipping” levels can work very well. The H1 chart below shows how just before the end of last Friday’s Tokyo session, the price bounced strongly off that level for the second time during the week, forming a small bearish pin candlestick marked by the down arrow in the price chart below, which immediately broke to the downside. Note how the end of a major session such as the Tokyo session can often be a great time to enter trades in major currency crosses which involve Asian currencies. This trade has given a very good acceptable maximum reward to risk ratio of approximately 5 to 1 so far.