Trading Support And Resistance - Sunday, August 25
This week we’ll begin with our monthly and weekly forecasts of the currency pairs worth watching. The first part of our forecast is based upon our research of the past 16 years of Forex prices, which show that the following methodologies have all produced profitable results:
- Trading the two currencies that are trending the most strongly over the past 3 months.
- Assuming that trends are usually ready to reverse after 12 months.
- Trading against very strong counter-trend movements by currency pairs made during the previous week.
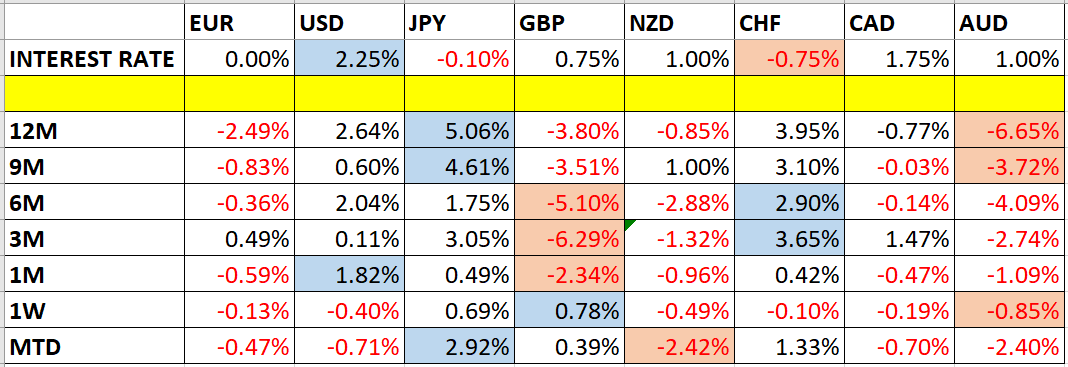
- Buying currencies with high interest rates and selling currencies with low interest rates.
Let’s look at the relevant data of currency price changes and interest rates to date, which we compiled using a trade-weighted index of the major global currencies:
Monthly Forecast August 2019
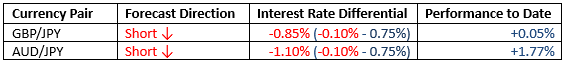
For the month of August, we forecast that the best trades would be short GBP/JPY and short AUD/JPY. The forecast’s performance to date is shown below:
Weekly Forecast August 25
Last week, we made no weekly forecast. We make no forecast again this week, as our weekly forecasts are based upon fading strong counter-trend movements, and there were no such movements over the past week.
The Forex market has remained relatively quiet, with less than 26% of the important currency pairs and crosses moving by more than 1% in value over the past week. Volatility is likely to be similar over the coming week.
Last week was dominated by relative strength in the British Pound, and relative weakness in the Australian Dollar.
Previous Monthly Forecasts
You can view the results of our previous monthly forecasts here.
Key Support/Resistance Levels for Popular Pairs
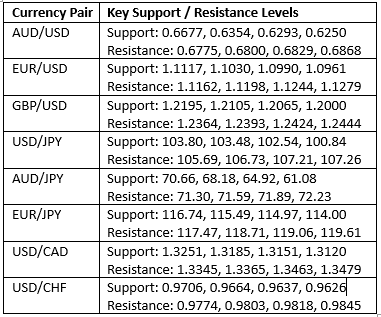
We teach that trades should be entered and exited at or very close to key support and resistance levels. There are certain key support and resistance levels that should be watched on the more popular currency pairs this week, which might result in either reversals or breakouts:
Let’s see how trading two of these key pairs last week off key support and resistance levels could have worked out:
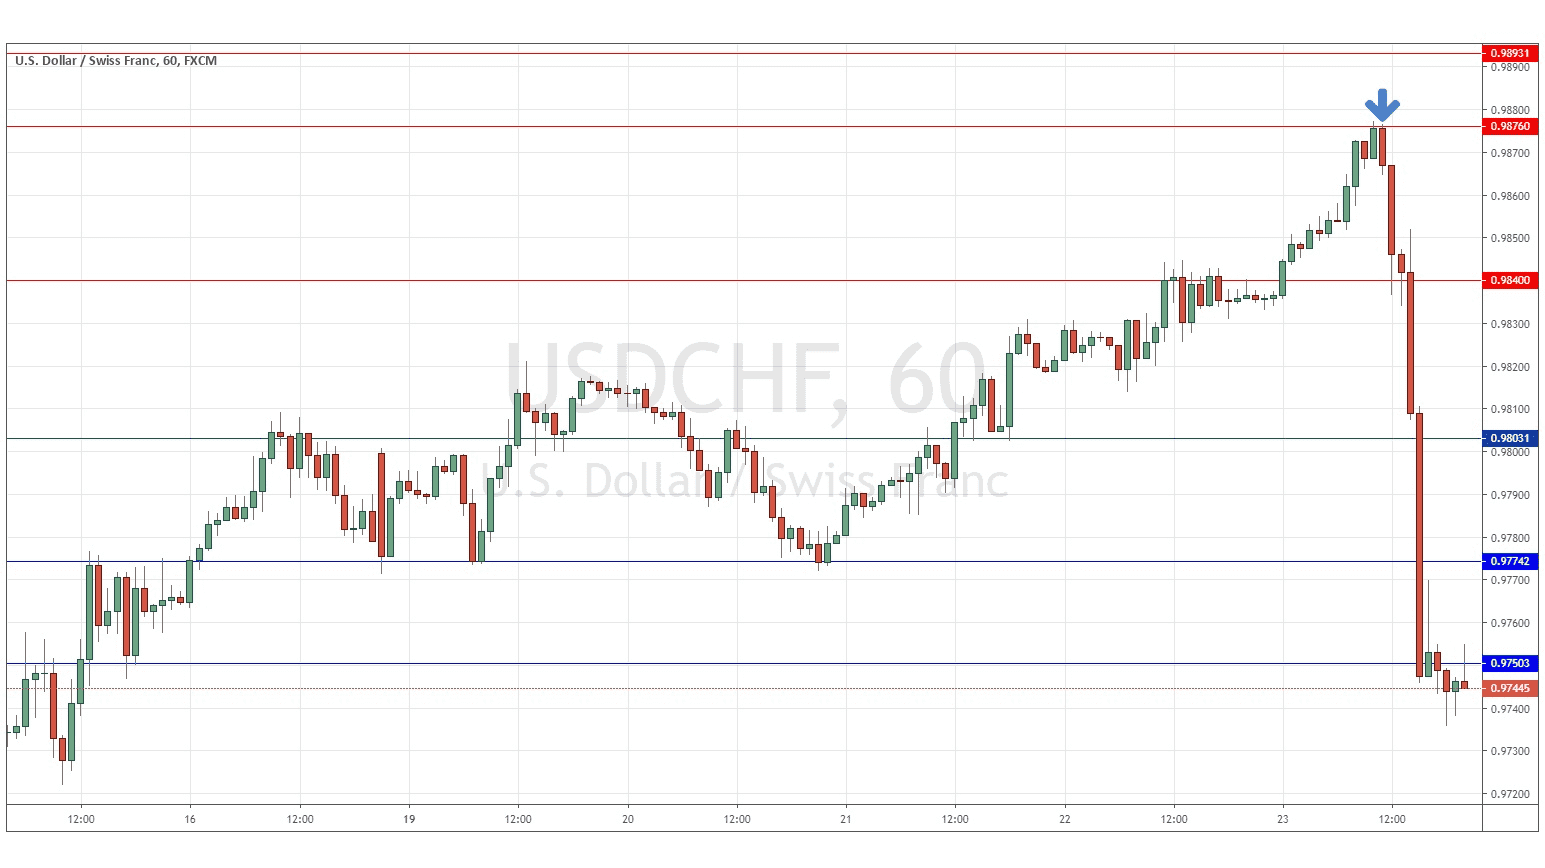
USD/CHF
We had expected the level at 0.9876 might act as resistance, as it had acted previously as both support and resistance. Note how these “flipping” levels can work well. The H1 chart below shows how the price rejected this level towards the start of last Friday’s New York session (a great time to trade U.S. Dollar currency pairs such as USD/CHF) turning bearish right away with an engulfing candlestick marked by the down arrow signaling the timing of the turn. This trade was profitable, achieving a maximum positive reward to risk ratio of approximately 8 to 1 so far based upon the size of the entry candlestick, due to the fast, strong directional movement.
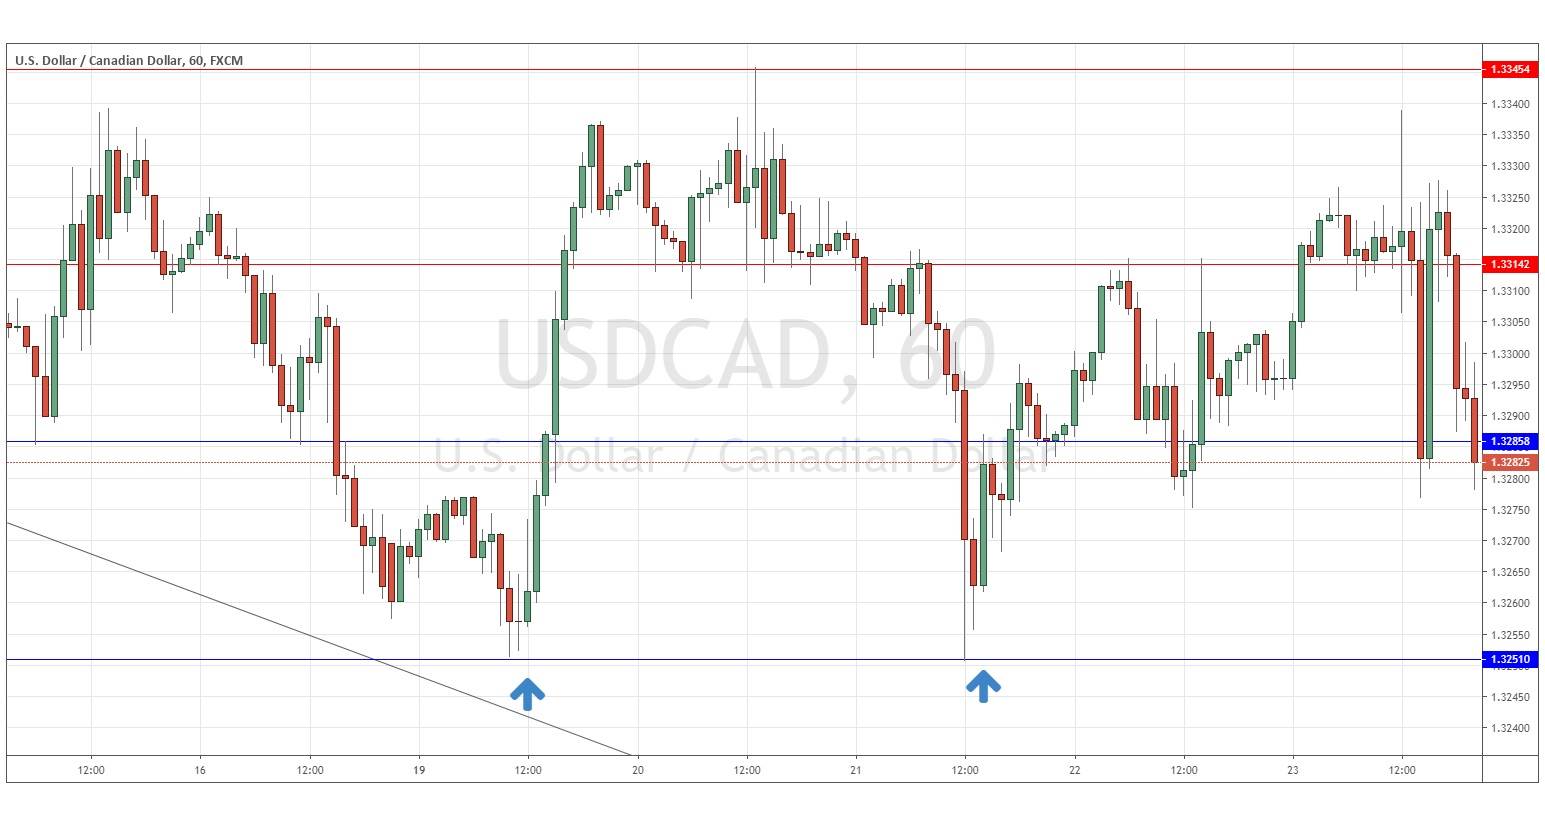
USD/CAD
We had expected the level at 1.3251 might act as support, as it had acted previously as both support and resistance. Note how these “flipping” levels can work well. The H1 chart below shows how the price rejected this level towards the start of last Monday’s New York session (a great time to trade U.S. Dollar currency pairs such as USD/CAD) turning bullish right away with a bullish inside candlestick break marked by the up arrow on the left signaling the timing of the turn. This trade was profitable, achieving a maximum positive reward to risk ratio of approximately 4 to 1 so far based upon the size of the entry candlestick. The trade set up for a second time later in the week as a double bottom formed at 1.3251, with the entry at the right-hand upwards arrow marked on the price chart below.